Mastering Values, Leadership, and
Change» (ISBN-13: 978-1405133562)

SDTEST® has 33 different VUCA polls that calculate the 12,299 correlation values between stages of development according to the theory of Spiral Dynamics and answer options of these 33 polls.
We invite curiosity about the systemic mechanisms behind this correlation. There may be hidden variables that provide alternative explanations.
0.0978 between the Age group 75 plus and the Purple stage.
The critical value of the correlation coefficient for a normal distribution, by William Sealy Gosset (Student) r = 0.0841. This positive correlation of 0.0978 meets the reliability criteria but does not necessarily imply causation.

While this positive correlation of 0.0978 between individuals aged 75 and older adhering to the Purple value system and experiencing ageism may be observed, it's essential to consider additional factors that could influence this relationship.
The lack of personalized information about the living conditions of survey participants highlights the need for a more nuanced understanding of the correlation. Without such information, it's challenging to determine the underlying reasons for the observed manifestation of ageism among individuals in this age group who identify with the Purple value system.
Factors such as socioeconomic status, access to healthcare, social support networks, and cultural attitudes toward aging could all play significant roles in shaping experiences of ageism. Without this personalized information, it's difficult to draw definitive conclusions about the relationship between adherence to Purple values and experiences of ageism among older individuals.
Therefore, while the correlation provides valuable insight into potential associations between age, values, and ageism, it's essential to recognize its limitations and further research to understand the underlying dynamics at play better. Without personalized information, the correlation serves as a starting point for exploration rather than a definitive explanation of the phenomenon.
0.1681 between the Age group 18-24 and the Red stage.
The critical value of the correlation coefficient for a normal distribution, by William Sealy Gosset (Student) r = 0.0826. This positive correlation of 0.1681 meets the reliability criteria but does not necessarily imply causation.
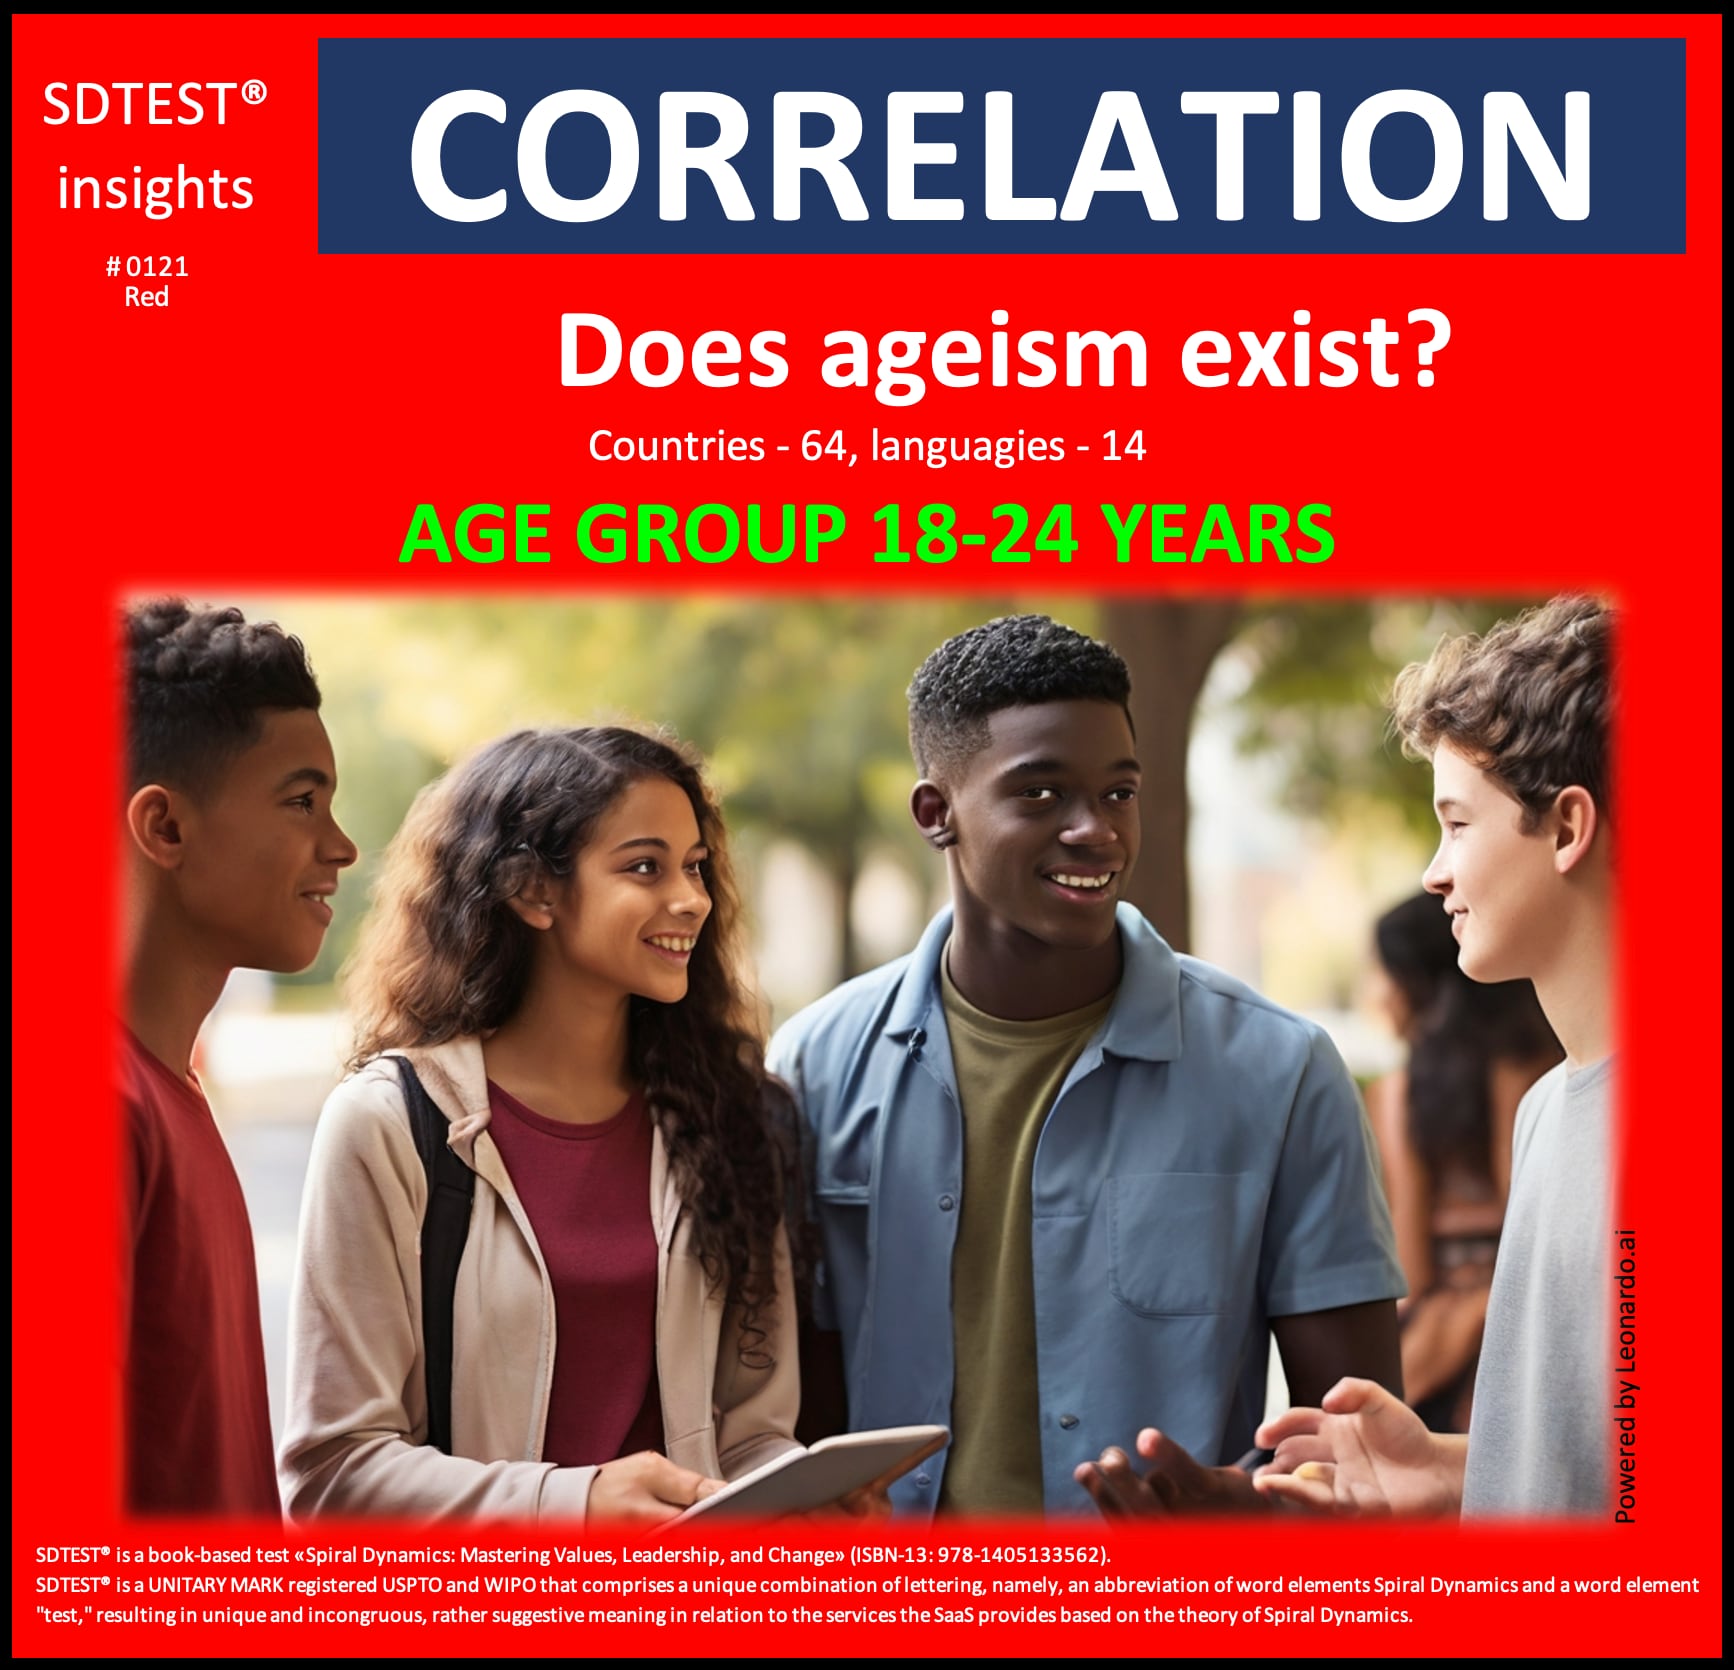
his positive correlation of 0.1681 suggests a potential association between exhibiting characteristics of the Red value system and existing ageism within the 18-24 age group. It raises questions about societal attitudes and perceptions toward assertive and individualistic behaviors among young adults. However, it's crucial to approach this correlation cautiously and recognize the data's limitations. The absence of personalized information on the living conditions of survey participants highlights the need for a more nuanced understanding of the factors contributing to experiences of ageism among young adults committed to the Red value system. We can only speculate about the underlying mechanisms driving this correlation without this contextual information.
1) Companies operating within the Red stage:
From a corporate standpoint rooted in the Red value system, today's correlation findings signify an opportunity to address ageism and empower young consumers through assertive and individualistic messaging. By embracing the assertive and competitive nature of the Red value system, companies can create empowering narratives that resonate with their target audience, fostering a sense of pride and belonging among young consumers.
2) Teams operating within the Red stage:
Today's correlation underscores the importance of addressing ageism and promoting inclusivity within the workplace. The team rooted in the Red value system values assertiveness, self-expression, and individualism. This correlation prompts teams to reflect on their attitudes and behaviors, ensuring they uphold their values while challenging ageist stereotypes and discrimination.
3) Individuals within the Red stage:
Individuals in the 18-24 age group understand the challenges of being assertive and individualistic in a world that may not always embrace these qualities, particularly for young adults. This correlation prompts them to advocate for themselves and challenge ageist stereotypes.
This negative correlation of -0.1524 suggests two intriguing possibilities:
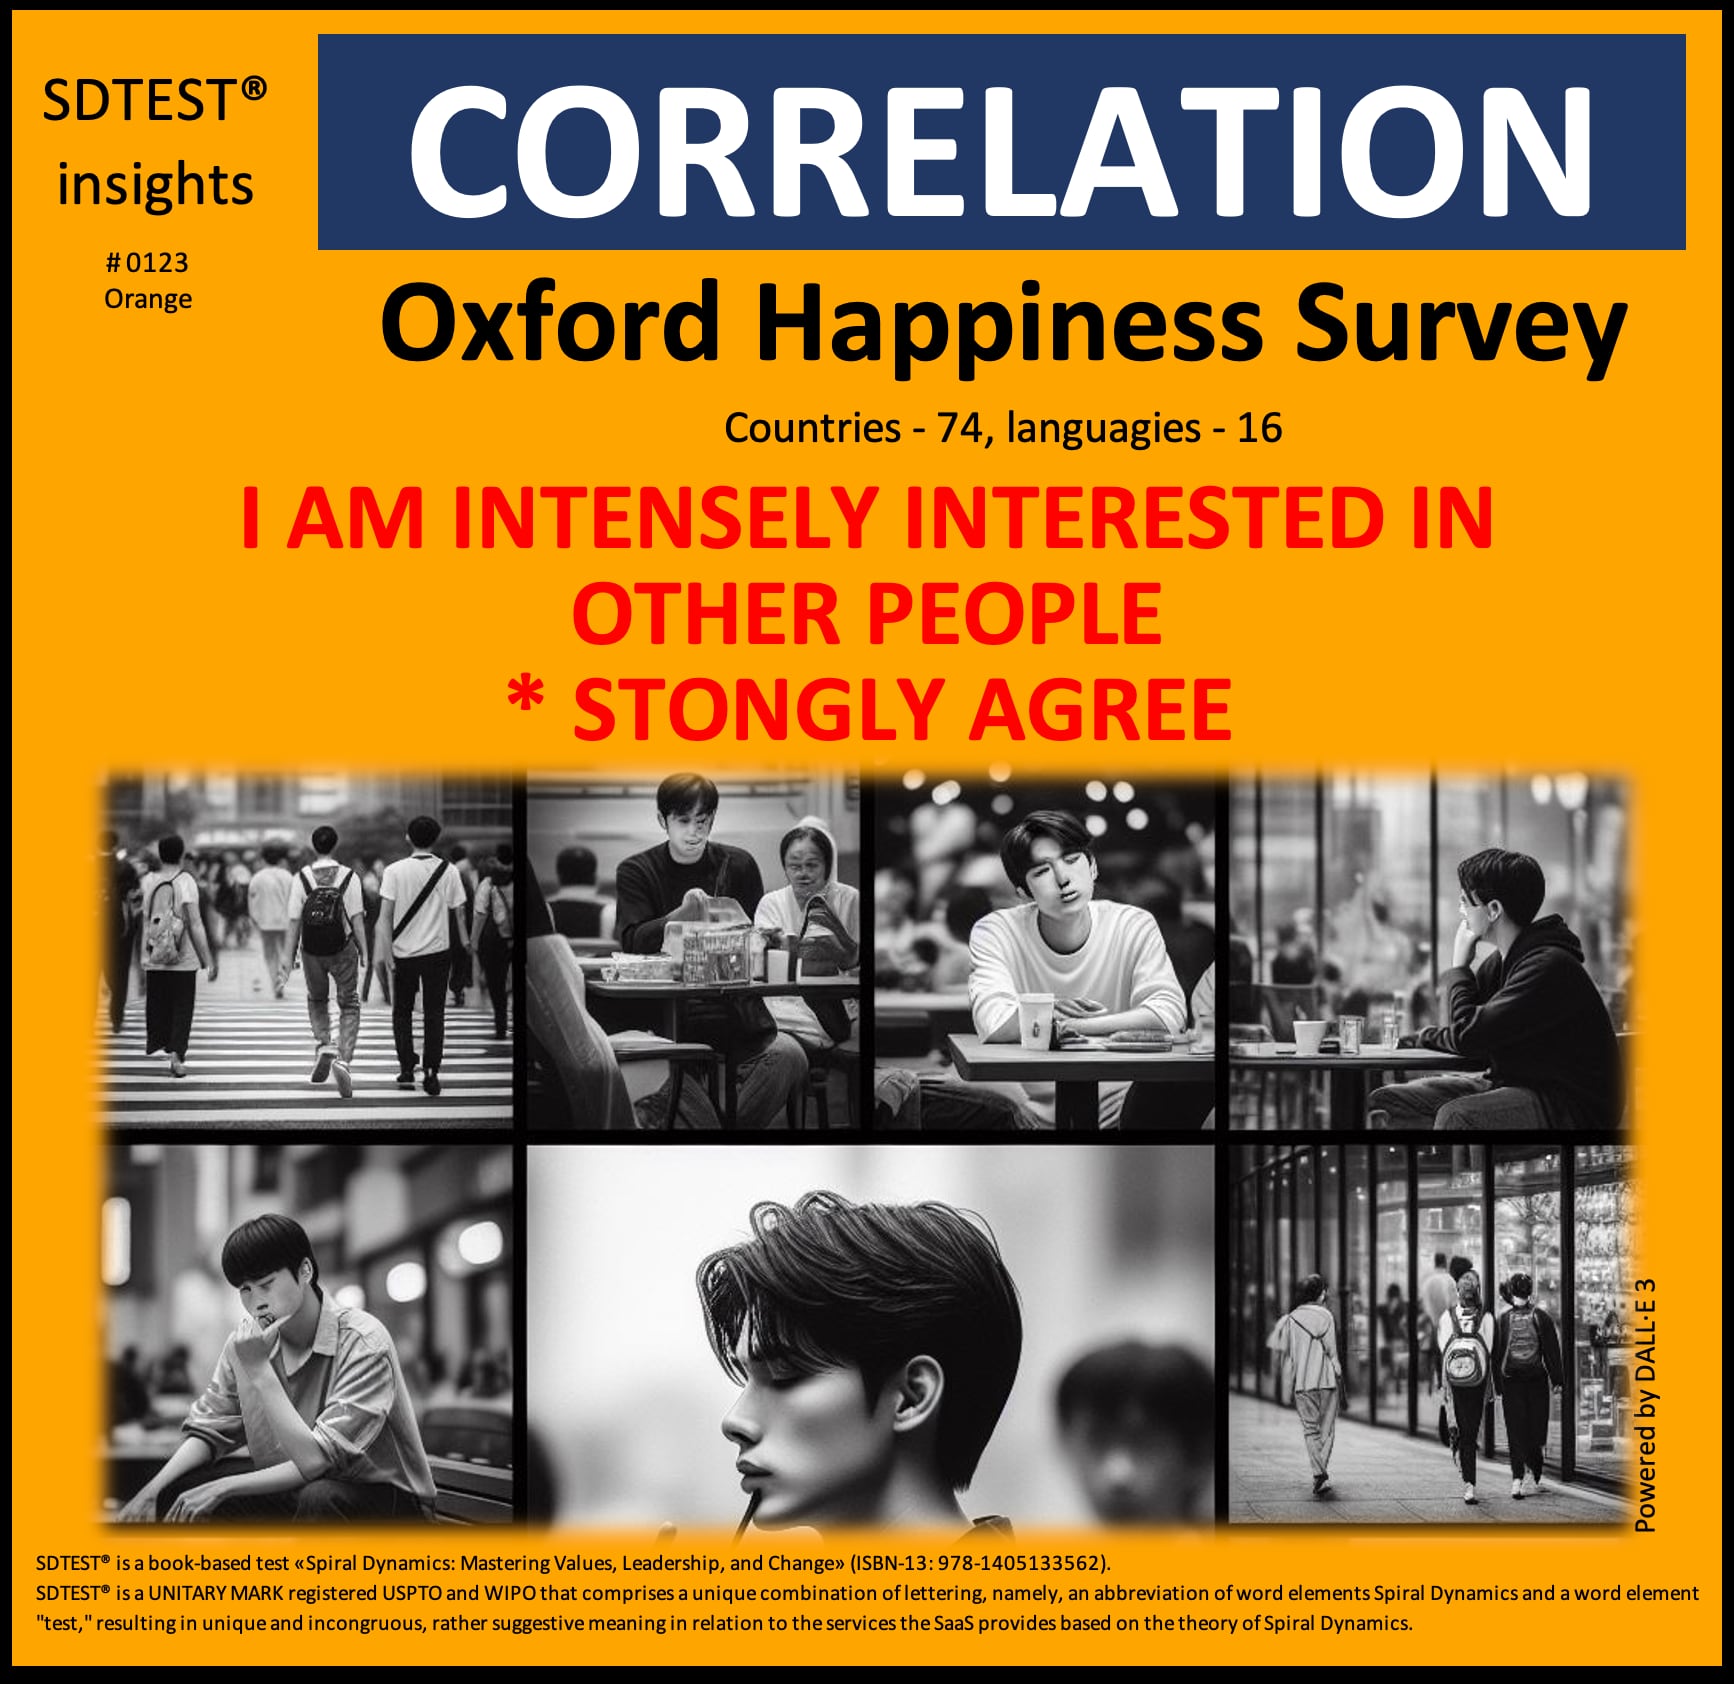
This negative correlation of -0.1280 suggests that as individuals exhibit stronger characteristics associated with the Orange value system, such as rationality, analytical thinking, and a focus on achieving goals, their adherence to being intensely interested in others tends to decrease.
This aligns with the principles of the Orange value system, which prioritizes efficiency, results, and individualistic pursuits. Individuals who strongly adhere to Orange values may prioritize personal goals and objectives over interpersonal relationships, leading to a decreased emphasis on being intensely interested in other people.
-0.0988 between the Positive relations with others. People would describe me as a giving person, willing to share my time with others. / Somewhat disagree, and the Green stage.
The critical value of the correlation coefficient for a normal distribution, by William Sealy Gosset (Student) r = 0.0533. This negative correlation of -0.0988 meets the reliability criteria but does not necessarily imply causation.
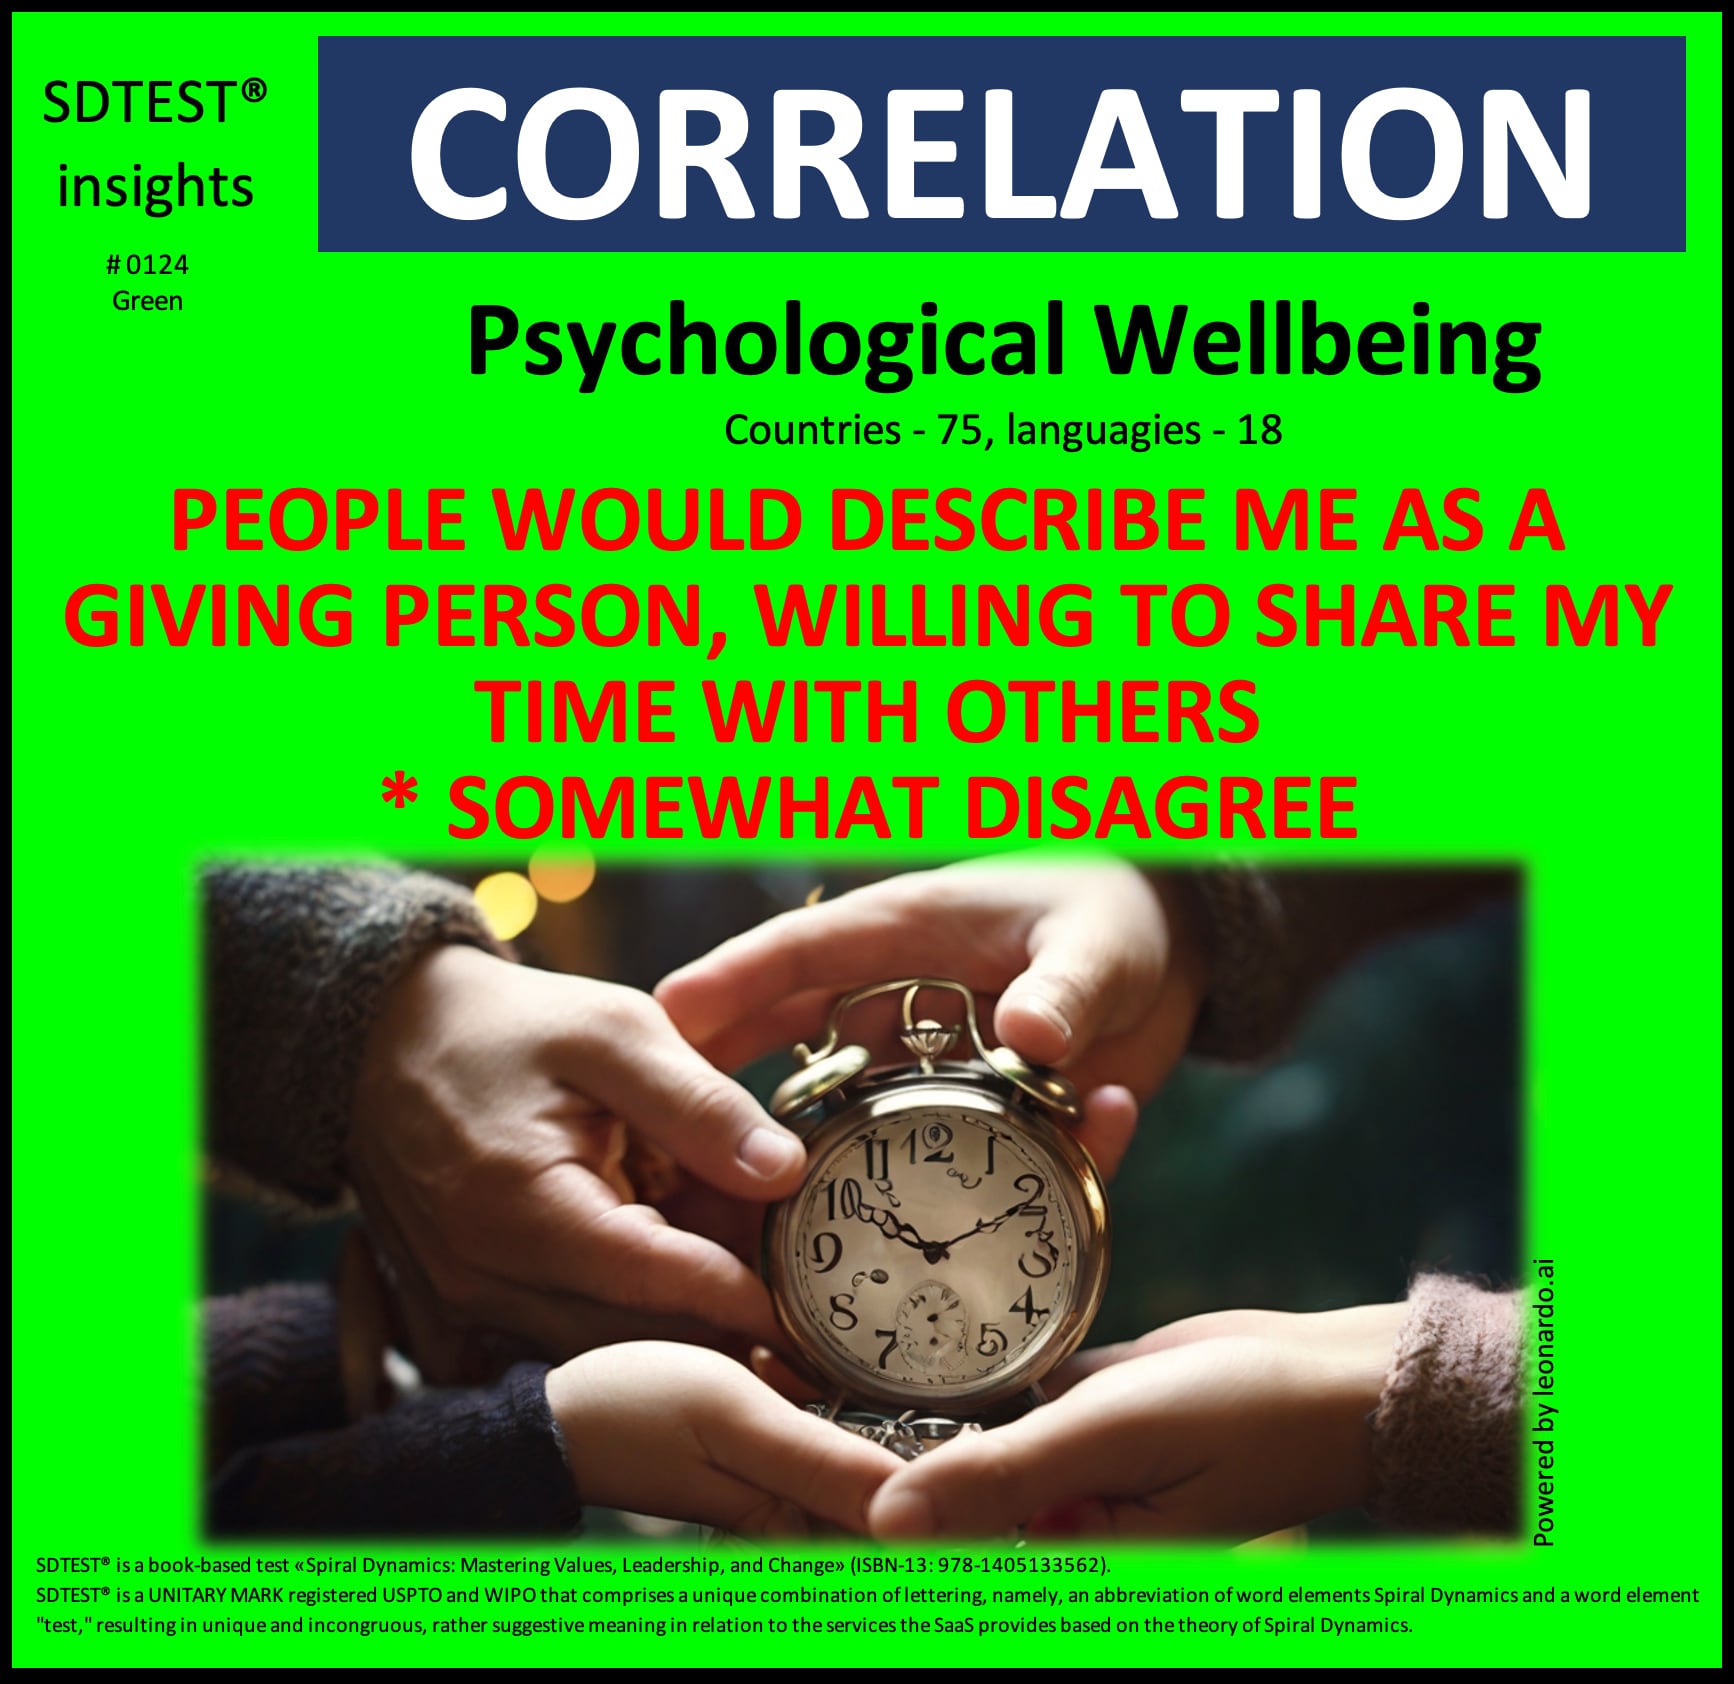
This negative correlation of -0.0988 suggests that individuals who strongly identify with the Green value system are less likely to express a "Somewhat disagree" sentiment when asked about being perceived as a giving person willing to share their time with others.
This observation arises from the interplay between two factors:
In essence, as individuals exhibit stronger alignment with Green values, they tend to differ less in their agreement with the statement mentioned above.
This is consistent with the principles of the Green value system, which underscore community, cooperation, and concern for the well-being of all. Individuals who prioritize these values may place less importance on seeking individual recognition or acknowledgment for their acts of generosity or altruism. Consequently, they may be less inclined to agree with statements about how others perceive them regarding giving or sharing their time.
0.0984 between the Yes, interpersonal interactions reflect broader social attitudes and the Yellow stage.
The critical value of the correlation coefficient for a normal distribution, by William Sealy Gosset (Student) r = 0.0905. This positive correlation of 0.0984 meets the reliability criteria but does not necessarily imply causation.
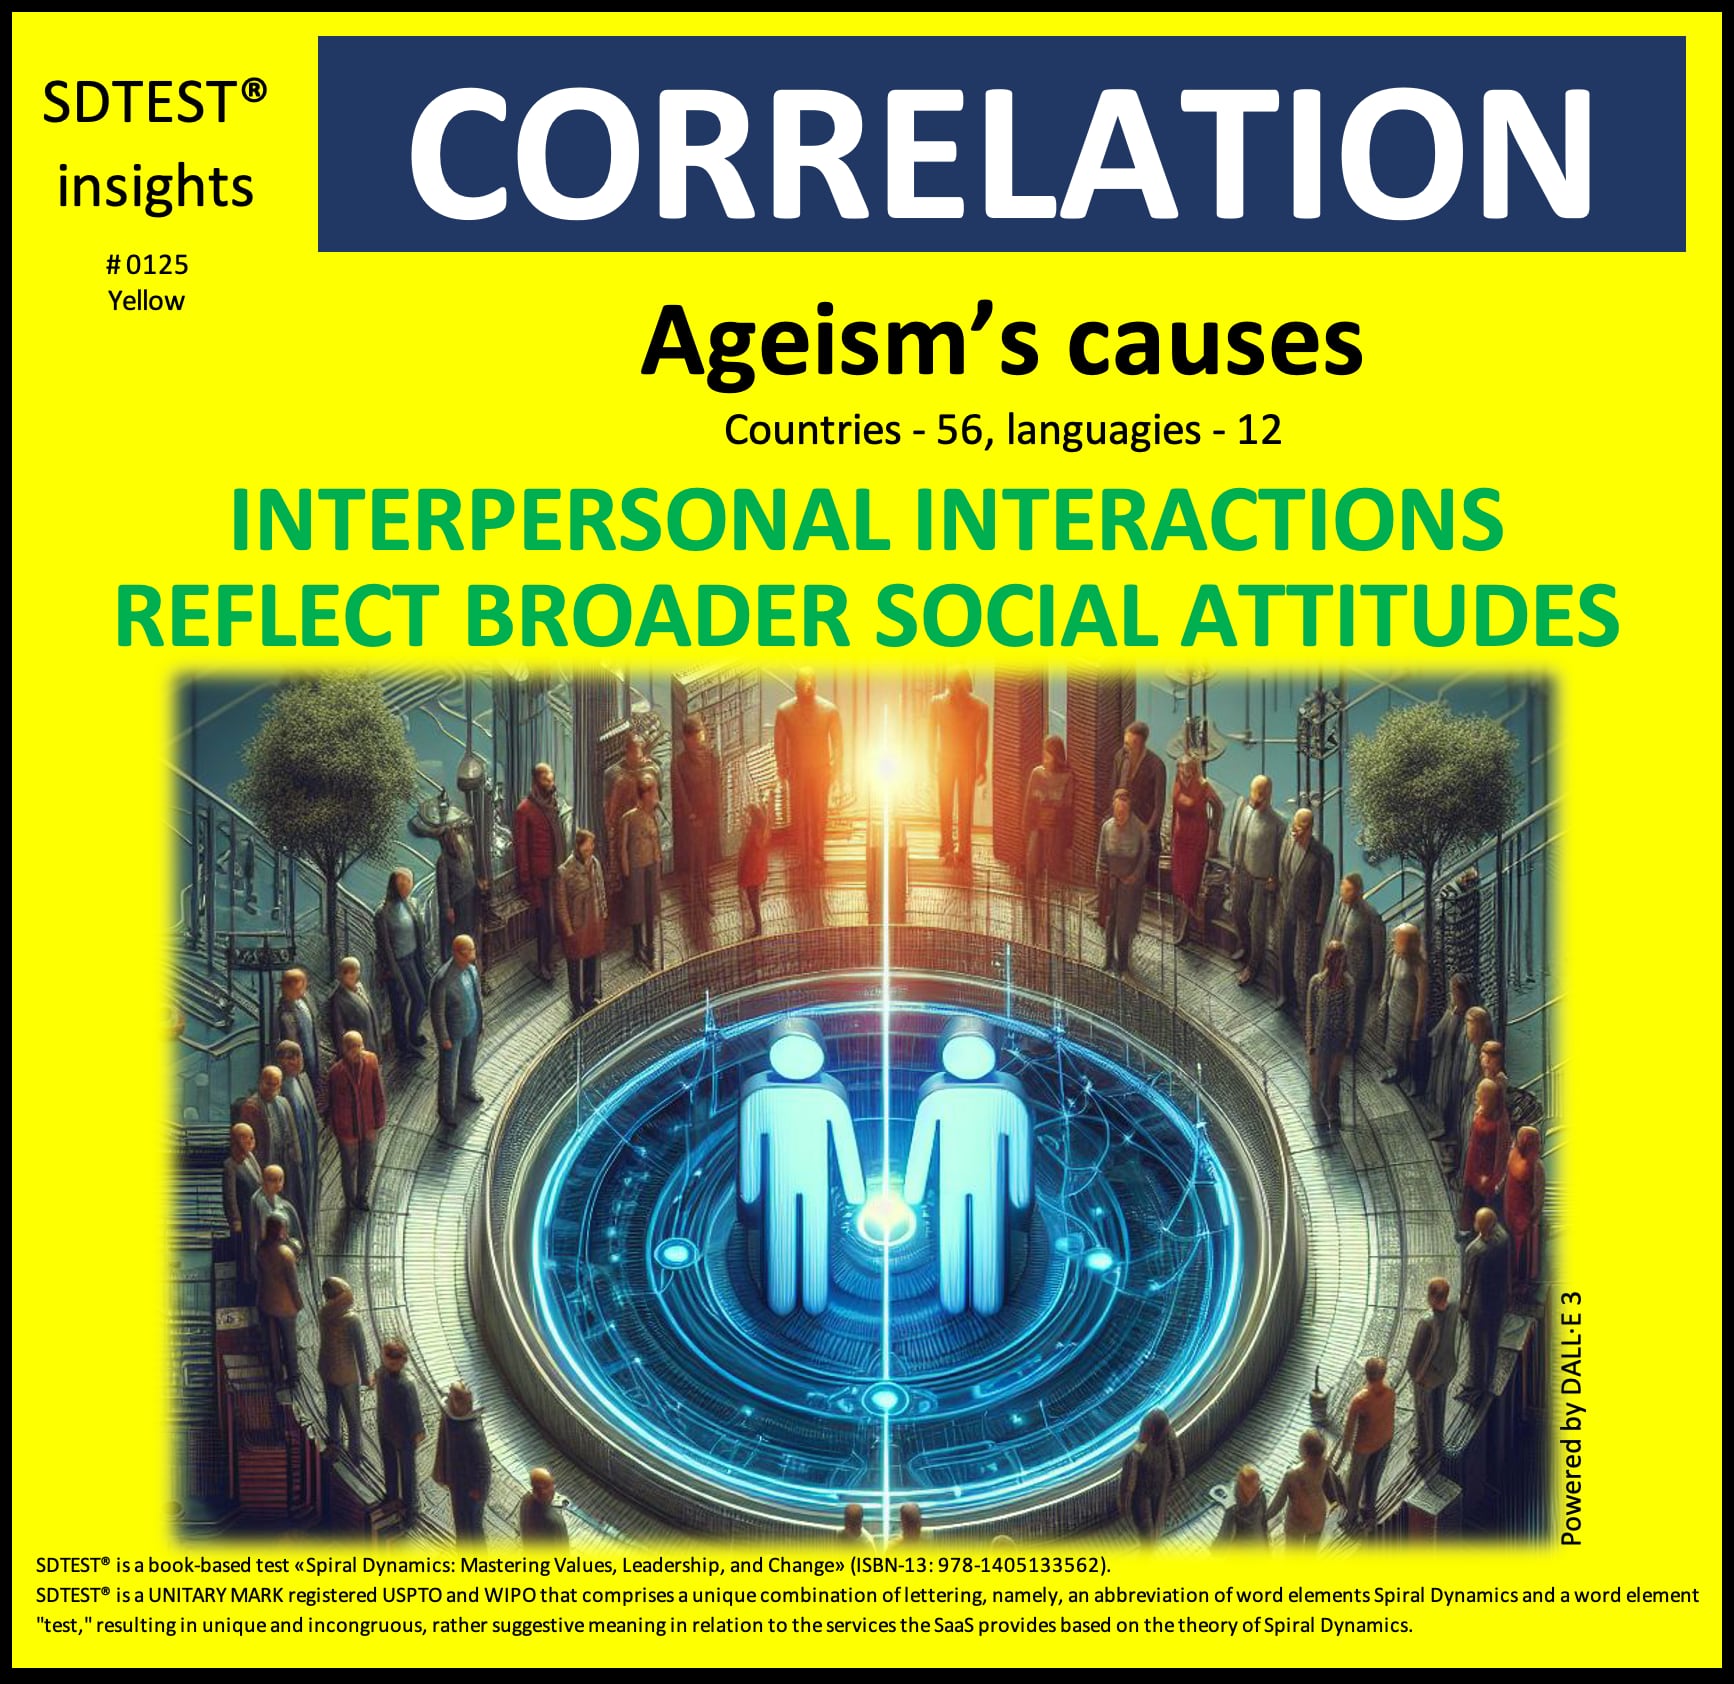
In the context of this positive correlation of 0.0984, recognizing that interpersonal interactions reflect broader social attitudes as a cause of ageism could resonate with the Yellow vMeme's emphasis on acknowledging complexity, embracing diverse perspectives, and understanding the interconnectedness of various systems and dynamics within society.
Individuals at the Yellow stage may be more inclined to perceive ageism as a multifaceted issue, rooted not only in individual biases but also in the broader social attitudes, cultural norms, and systemic factors that shape interpersonal interactions and behaviors.
Furthermore, the Yellow value system's focus on personal growth and development could contribute to a heightened awareness of the influence of societal attitudes and the importance of recognizing and addressing such factors to foster a more inclusive and equitable environment for individuals of all ages.

This positive correlation of 0.0813 suggests that Turquoise visionaries and startup explorers are united in their restless hunger to transcend artificial boundaries and catalyze new thriving forms. Where others cling to fragmented worldviews, they seek an ecological perspective that illuminates the interdependence of all systems - economic, social, environmental, and technological.
Just as startups dare to be the upstart vanguards disrupting the old order, those resonating with the Turquoise frequency have evolved beyond formulaic approaches to become avant-garde facilitators of humanity's continued flowering. In their noble striving toward greater wholeness and planetary sustainability, both share a kindred impulse to midwife the emergence of a higher synthesis - a reunion of all seeming polarities into one breathtakingly integrative systemic integrity.
What insights do you gain from today's correlation? How might we study this relationship more carefully before deducing causation?
We welcome respectful and wise perspectives! Stay tuned every week as we share more results and insights.
After login or registration, free access to the poll results in the FAQ section.
