Mastering Values, Leadership, and
Change» (ISBN-13: 978-1405133562)

SDTEST® has 28 different VUCA polls that calculate the 9,191 correlation values between stages of development according to the theory of Spiral Dynamics and answer options of these 28 polls.
We invite curiosity about the systemic mechanisms behind this correlation. There may be hidden variables that provide alternative explanations.
0.0931 between the Feel they have something to lose and the Purple stage.
The critical value of the correlation coefficient for a normal distribution, by William Sealy Gosset (Student) r = 0.0627. This positive correlation of 0.0931 meets the reliability criteria but does not necessarily imply causation.

This positive correlation of 0.0931 connects to the Purple value system's tight communal bonds and customary ways of life. When existence revolves around ancestral rituals and tribal belonging, shifts threatening these structures jeopardize one's very sense of meaning.
The prospect of exile from familiar patterns rightfully evokes fear. Without a spiritual community, Purple psychology loses all orientation. So reactions to guard against change emerge strongly; risk-taking is rare when transforms may upend all security.
We should only assume assumptions either way until examining this correlation rigorously across various situations. As with all developmental worldviews, Purple psychology contains multidimensionality worth unpacking! We'd like to hear more from you here.
We talked about this poll in more detail in this article.
-0.0944 between the Present and the Red stage.
The critical value of the correlation coefficient for a normal distribution, by William Sealy Gosset (Student) r = 0.0686. This negative correlation -0.0944 meets the reliability criteria but does not necessarily imply causation.
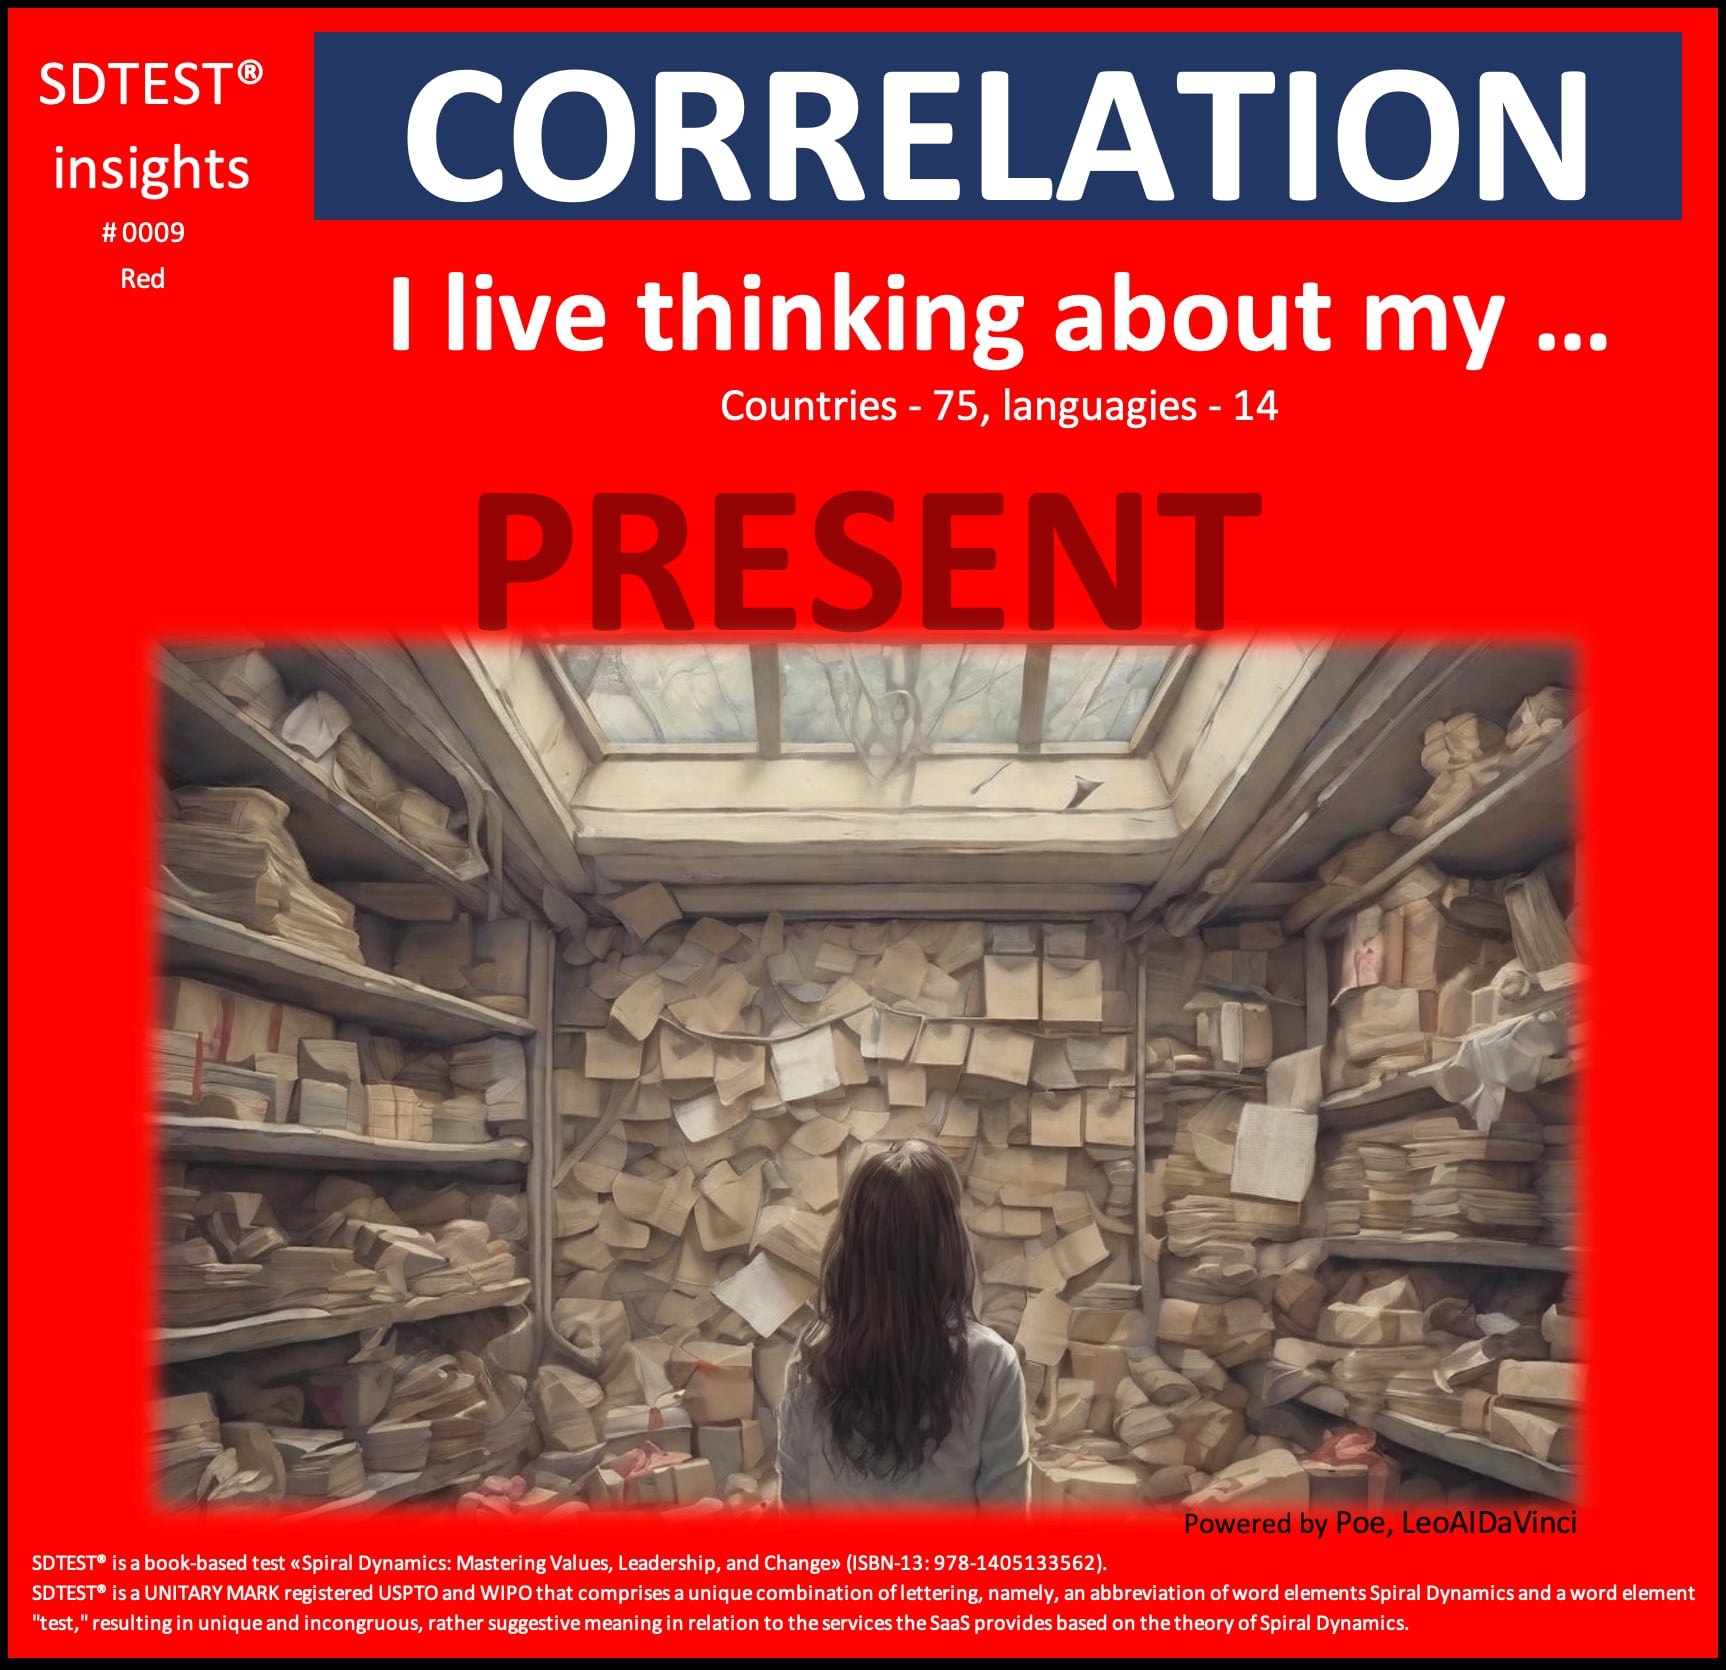
We see the inconsistency between the negative correlation and Red psychology's innate present-focus:
So, we see a negative correlation between Red and present-moment focus, which goes against Red's intrinsic nature.
This logical gap provokes important reflection about potential meanings:
That is an insightful catch! The contradiction deserves deeper investigation to unpack the psychological and methodological implications. Please share any other interpretations that could explain this logical gap. Reconciling theory and data is crucial for coherence.
-0.067 between the Return to repression and the Blue stage.
The critical value of the correlation coefficient for a normal distribution, by William Sealy Gosset (Student) r = 0.0369. This negative correlation of -0.067 meets the reliability criteria but does not necessarily imply causation.
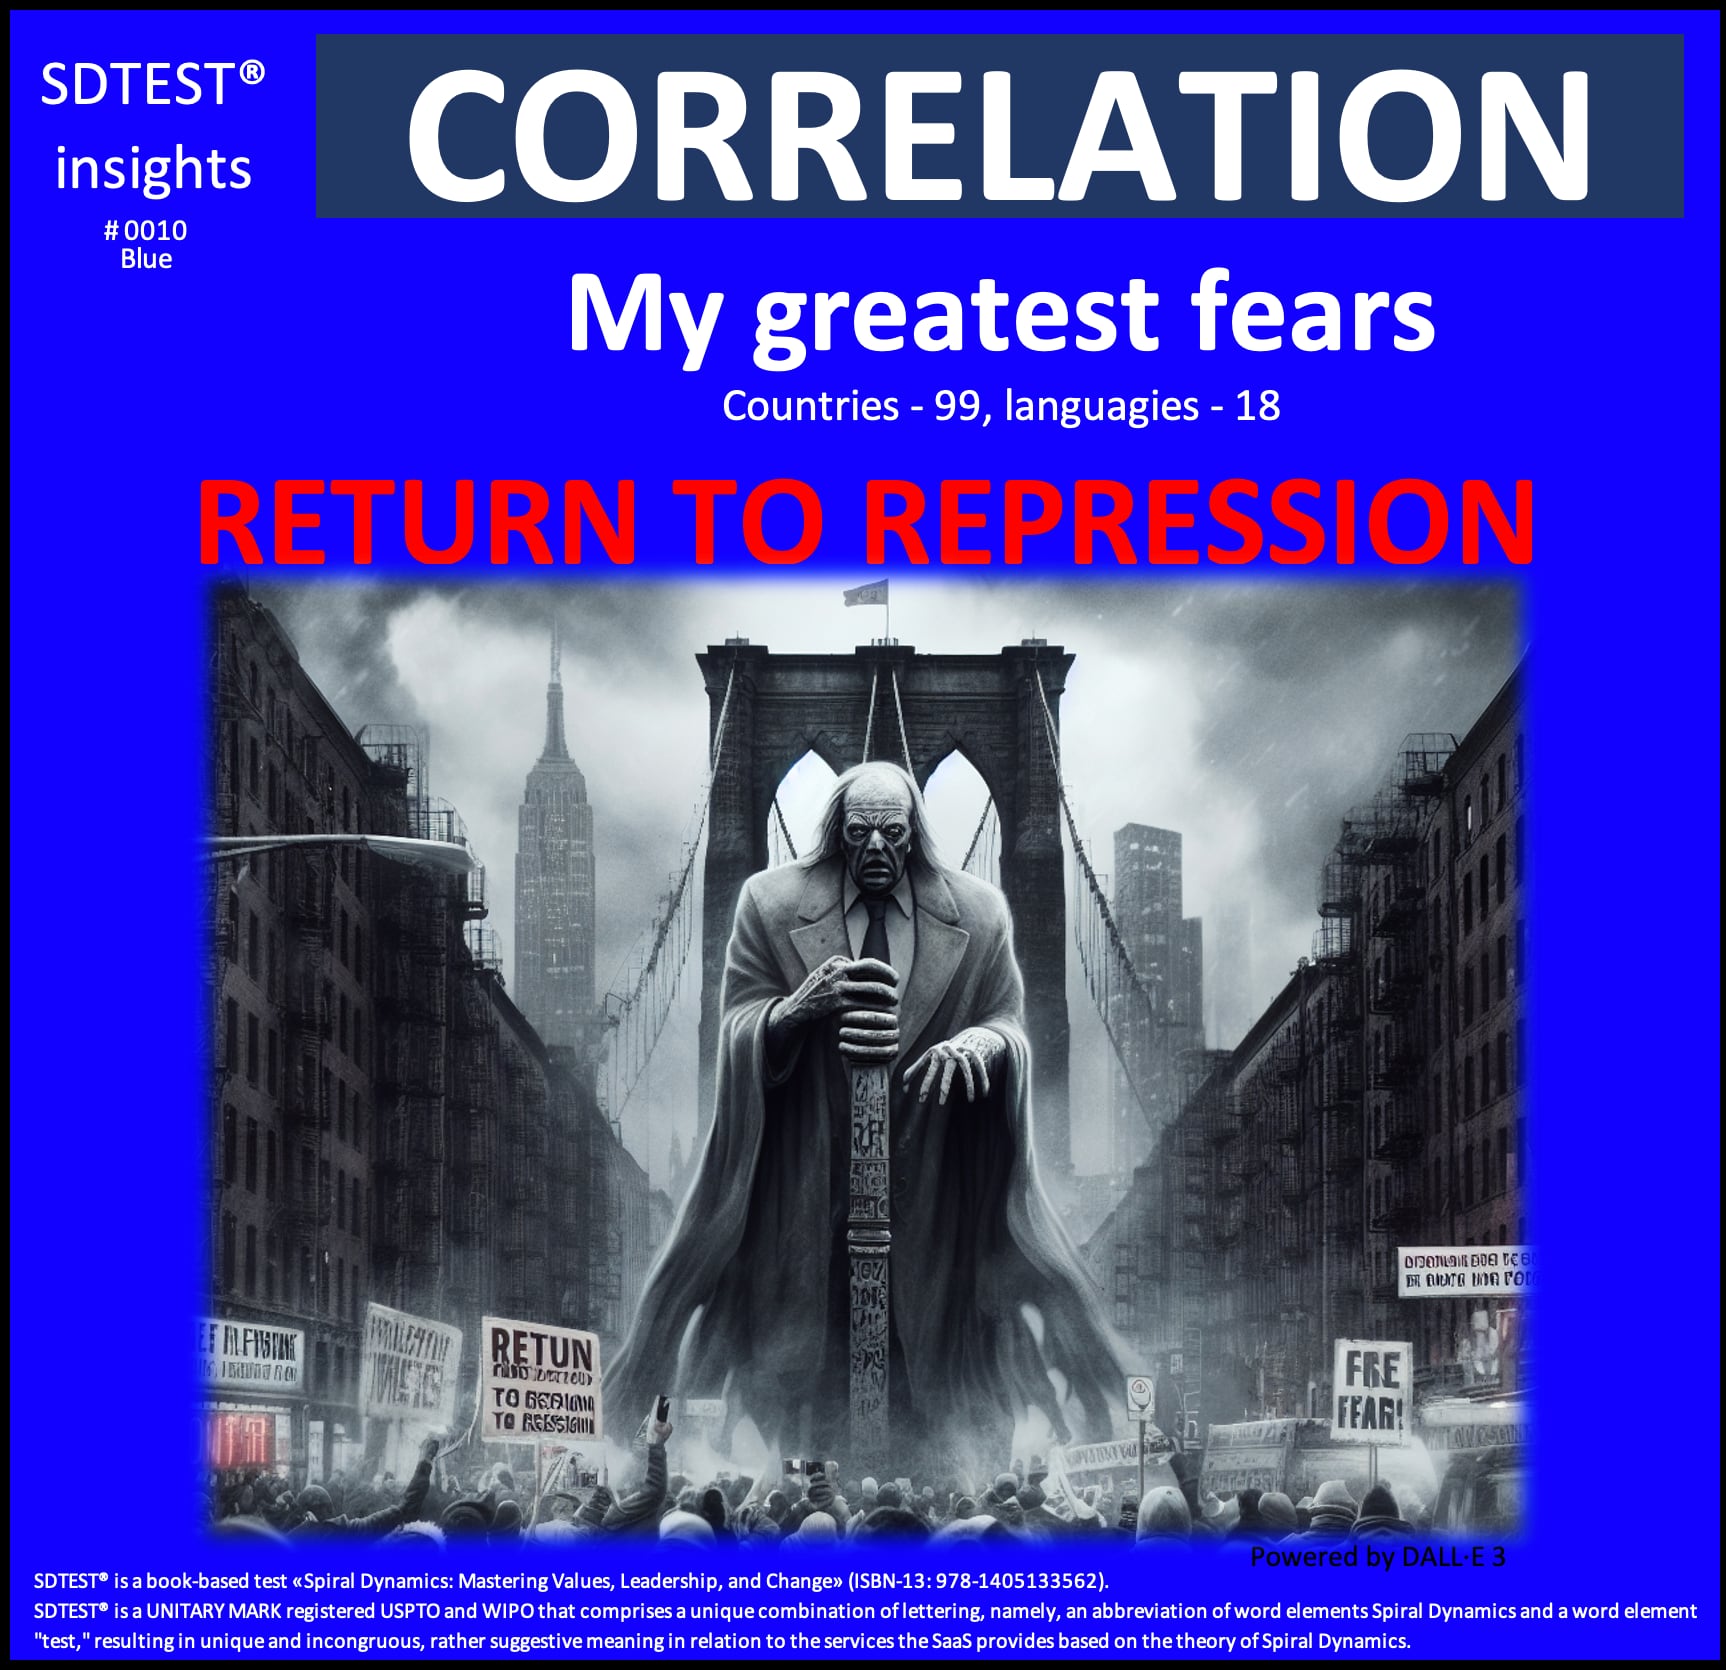
A negative correlation between Blue psychology and fearing a return to repression initially seems contradictory. By nature, Blue values rules, hierarchy, and moral order as bulwarks against chaos.
So, what could explain this puzzling inverse relationship that defies Blue's intrinsic philosophy?
Some hypotheses:
We talked about this poll in more detail in this article.
0.1245 between I am not ready to receive less pay to work remotely and Orange stage.
The critical value of the correlation coefficient for a normal distribution, by William Sealy Gosset (Student) r = 0.0687. This positive correlation of 0.1245 meets the reliability criteria but does not necessarily imply causation.
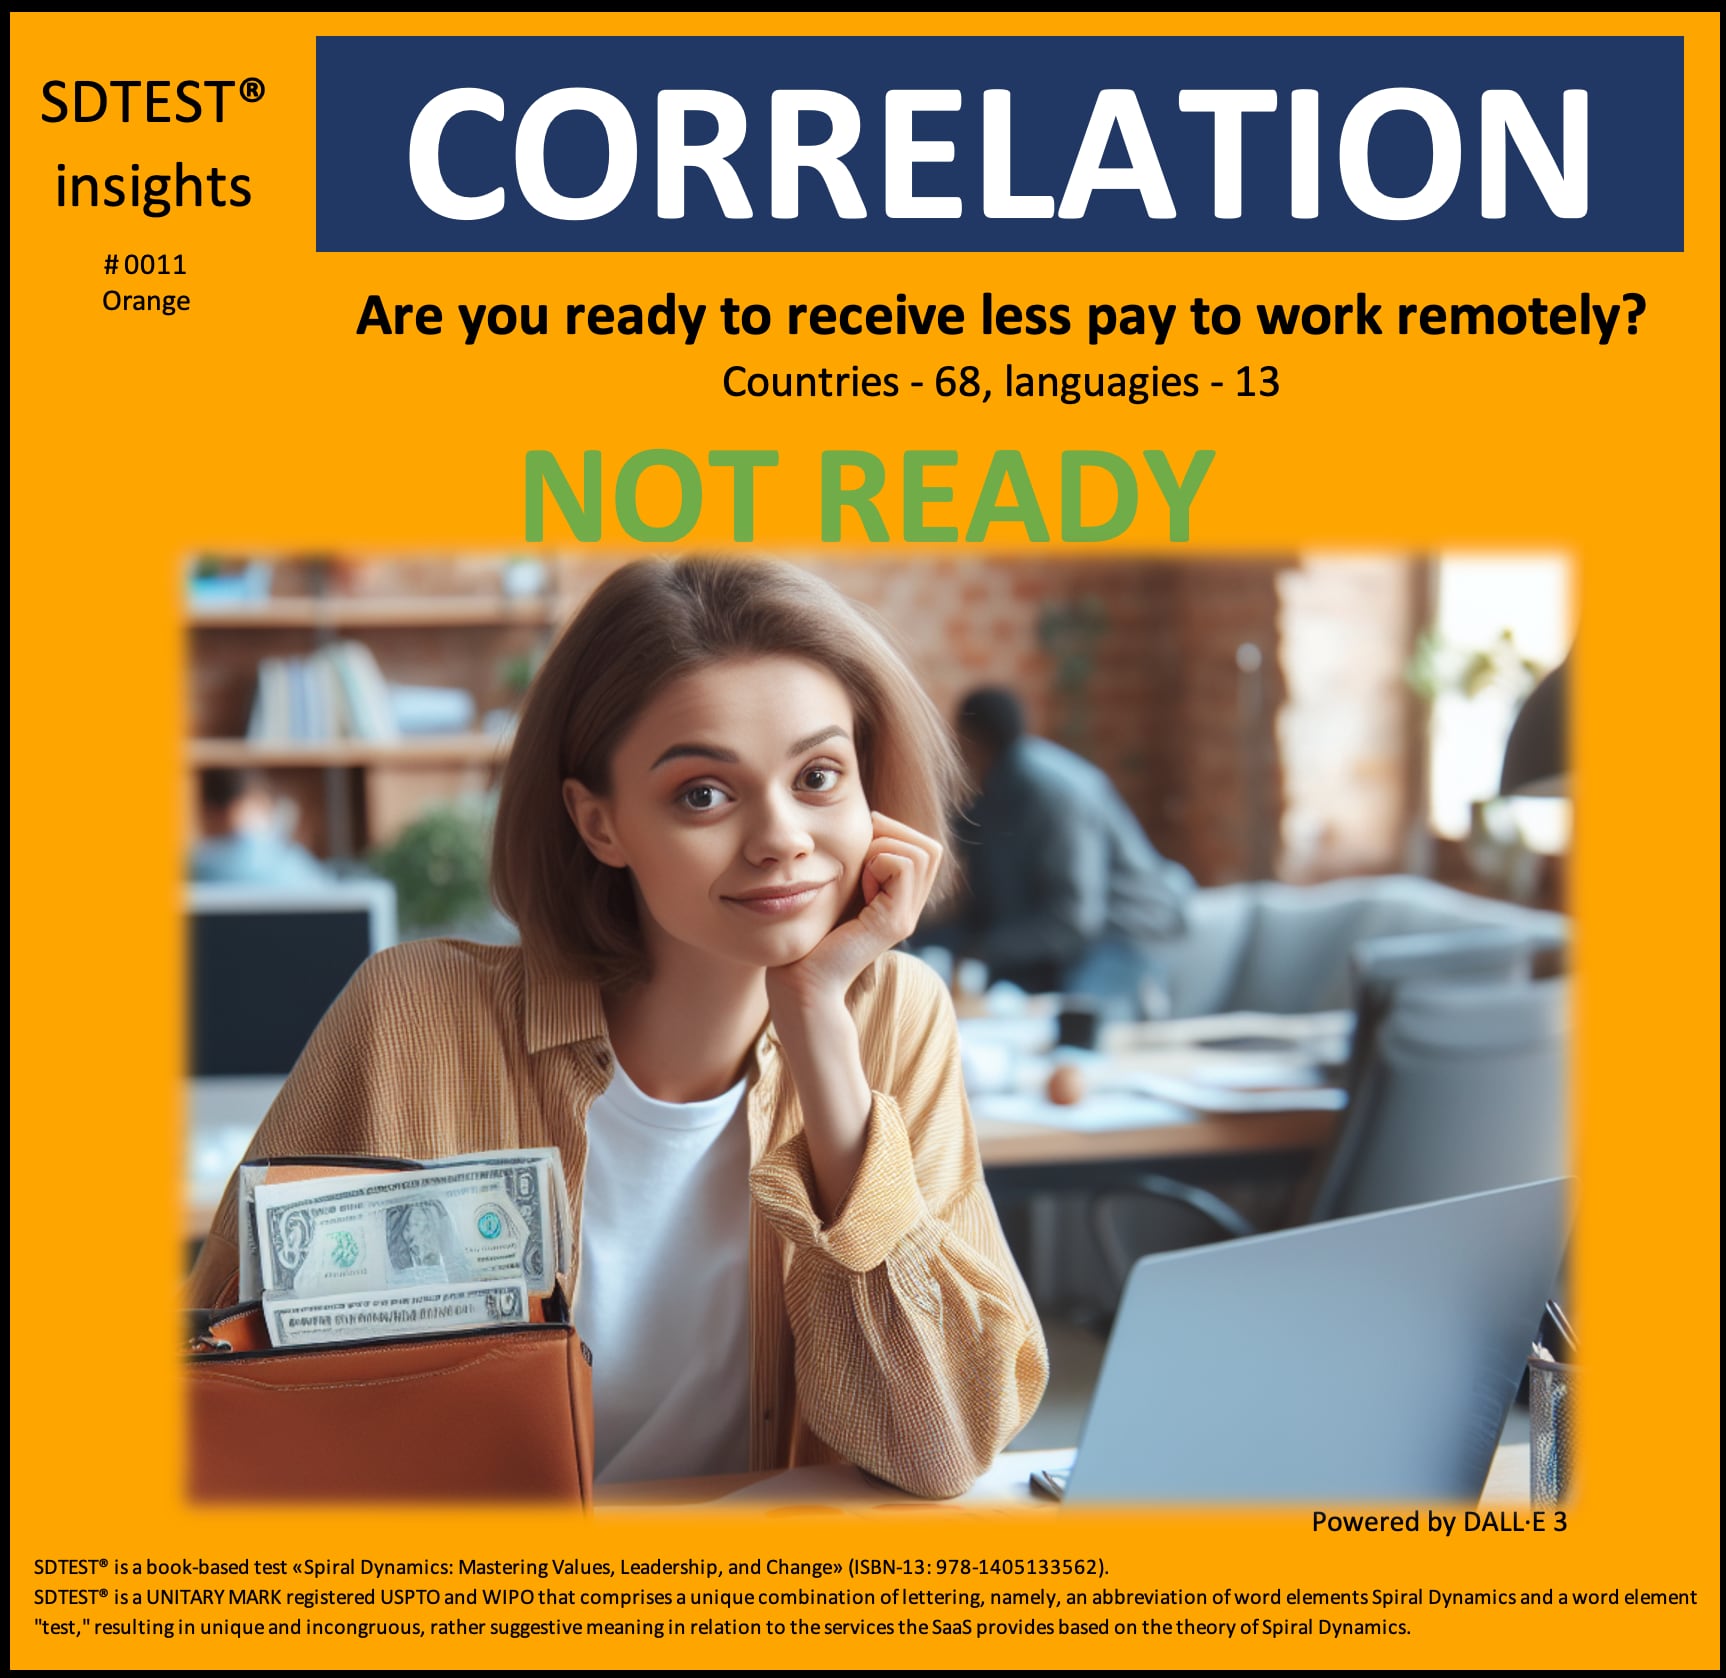
This positive correlation of 0.1245 resonates with key aspects of achievement-oriented Orange psychology. Viewing workplace dynamics through a lens of rational goals and incentives, Orange's thinking balks at the notion of reduced pay for equivalent productivity simply due to location.
Valuing measurable outputs over processes, those identifying with Orange success paradigms expect proper compensation for hitting targets and furthering strategic objectives. They pride pay rates on meritocratic contributions, not appearances.
0.0969 between the Ageism is not the result only of interpersonal interactions and the Green stage.
The critical value of the correlation coefficient for a normal distribution, by William Sealy Gosset (Student) r = 0.0955. This positive correlation of 0.0969 meets the reliability criteria but does not necessarily imply causation.
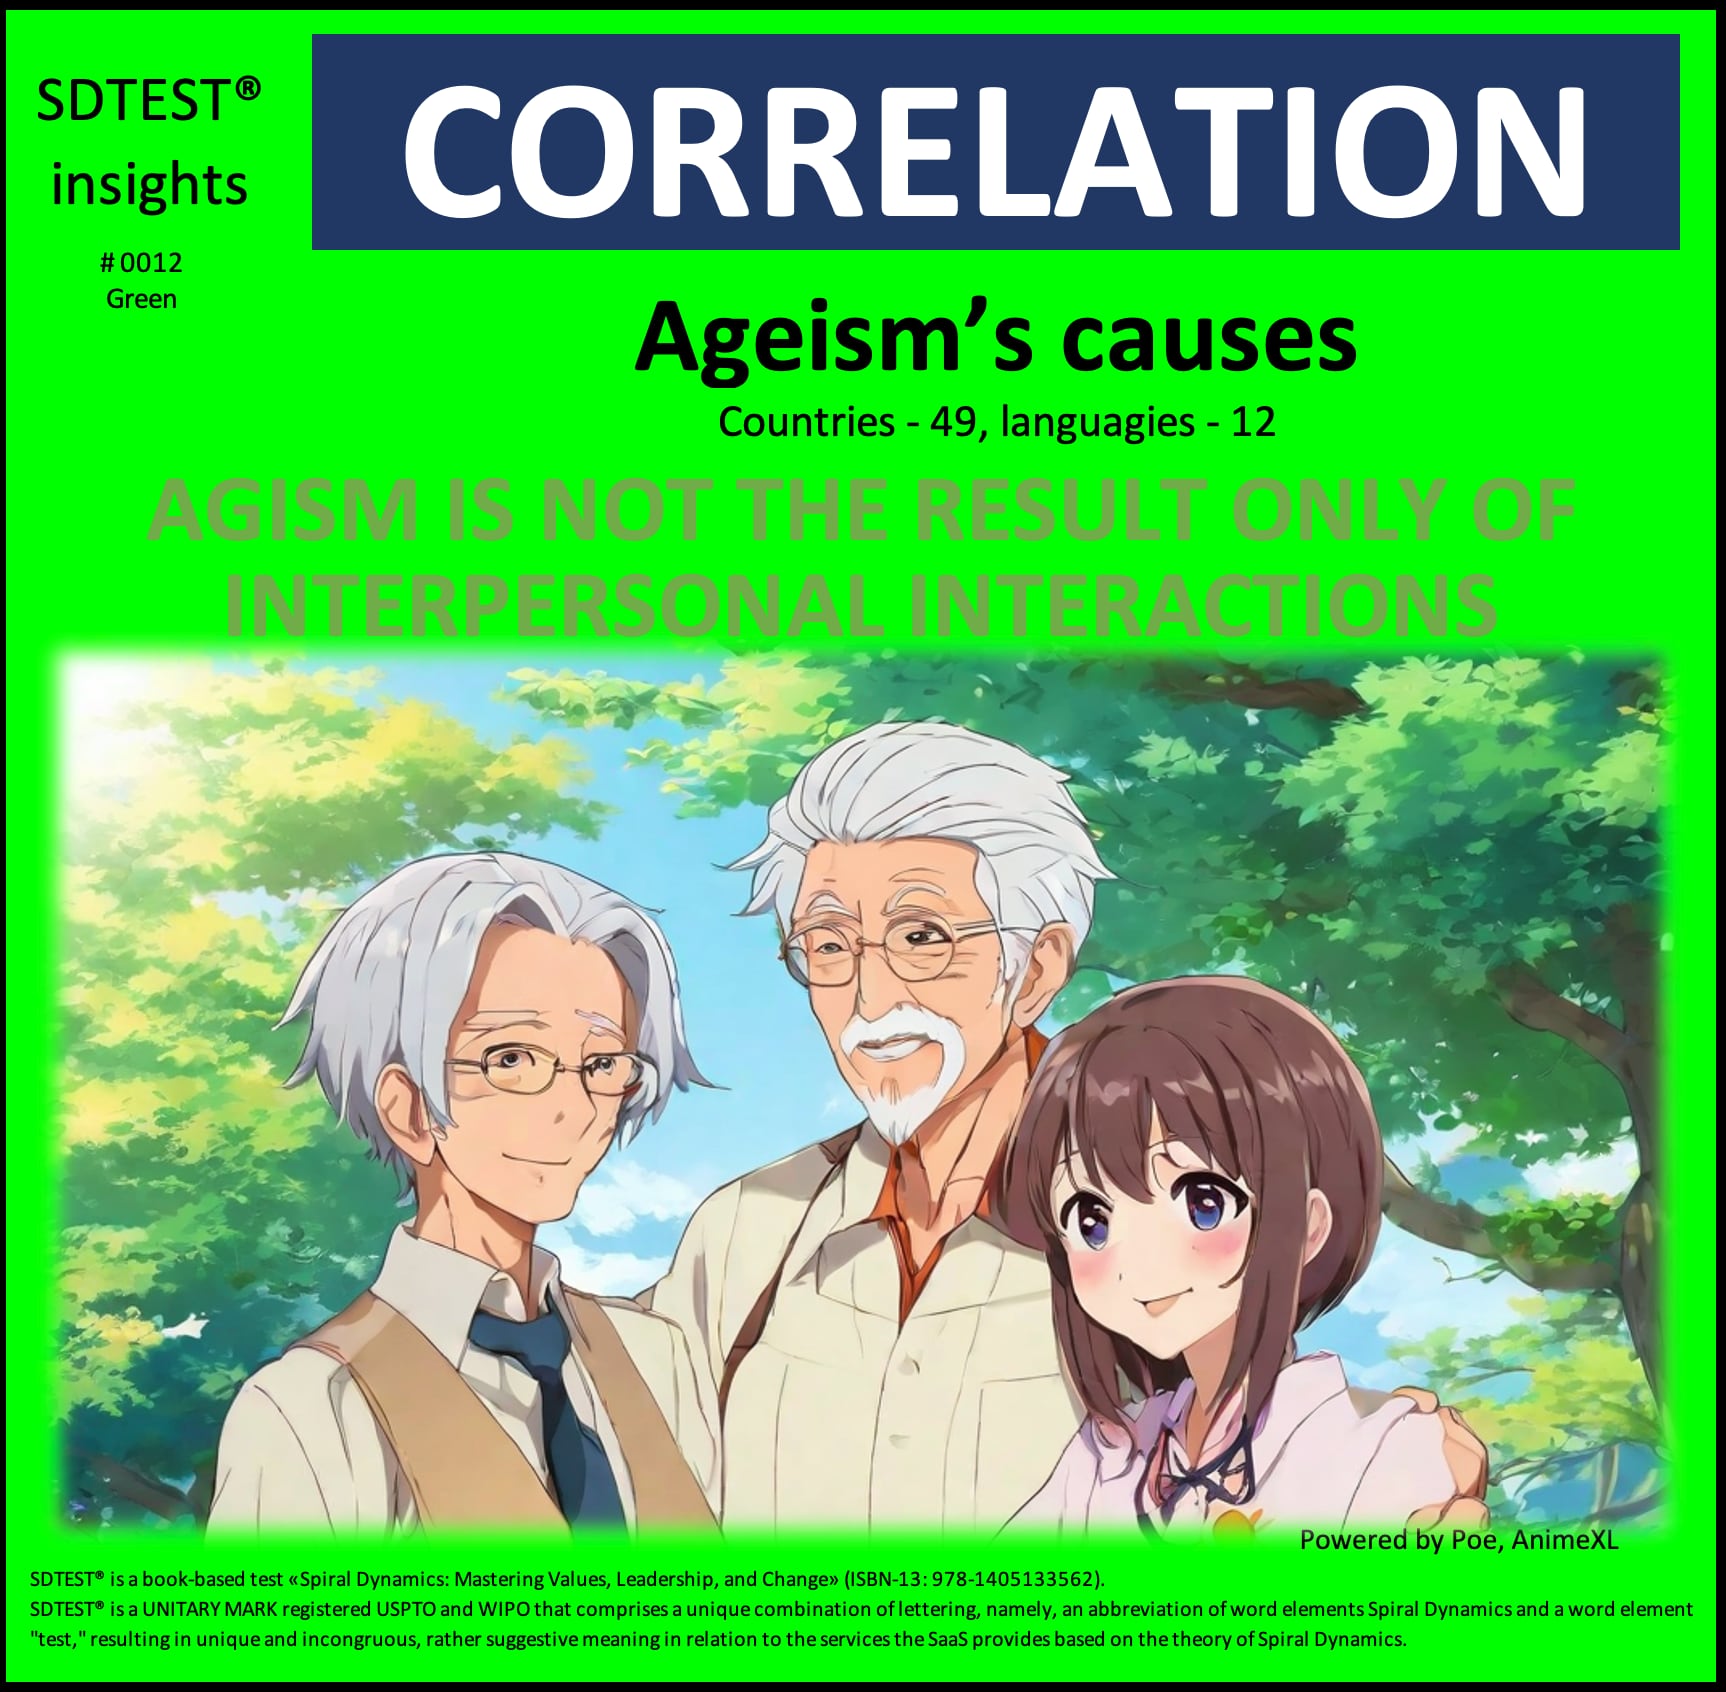
This positive correlation of 0.0969 resonates with the Green worldview's orientation toward analyzing interlocking social, cultural, and institutional dynamics that shape group experiences. Viewing society through a lens of interconnected systems, Green psychology sees ageism arising from complex historical biases becoming embedded in organizational policies, media stereotypes, and more.
Rather than locating prejudice solely in individual hostile behaviors, Green thinking considers how taken-for-granted assumptions are absorbed into societal structures in ways that restrict dignity and potential based on attributes like age. They feel compelled to address root causes perpetuating marginalization.
0.1171 between the Yes, ageism exists within my family and community and the Yellow stage.
The critical value of the correlation coefficient for a normal distribution, by William Sealy Gosset (Student) r = 0.0866. This positive correlation of 0.1171 meets the reliability criteria but does not necessarily imply causation.
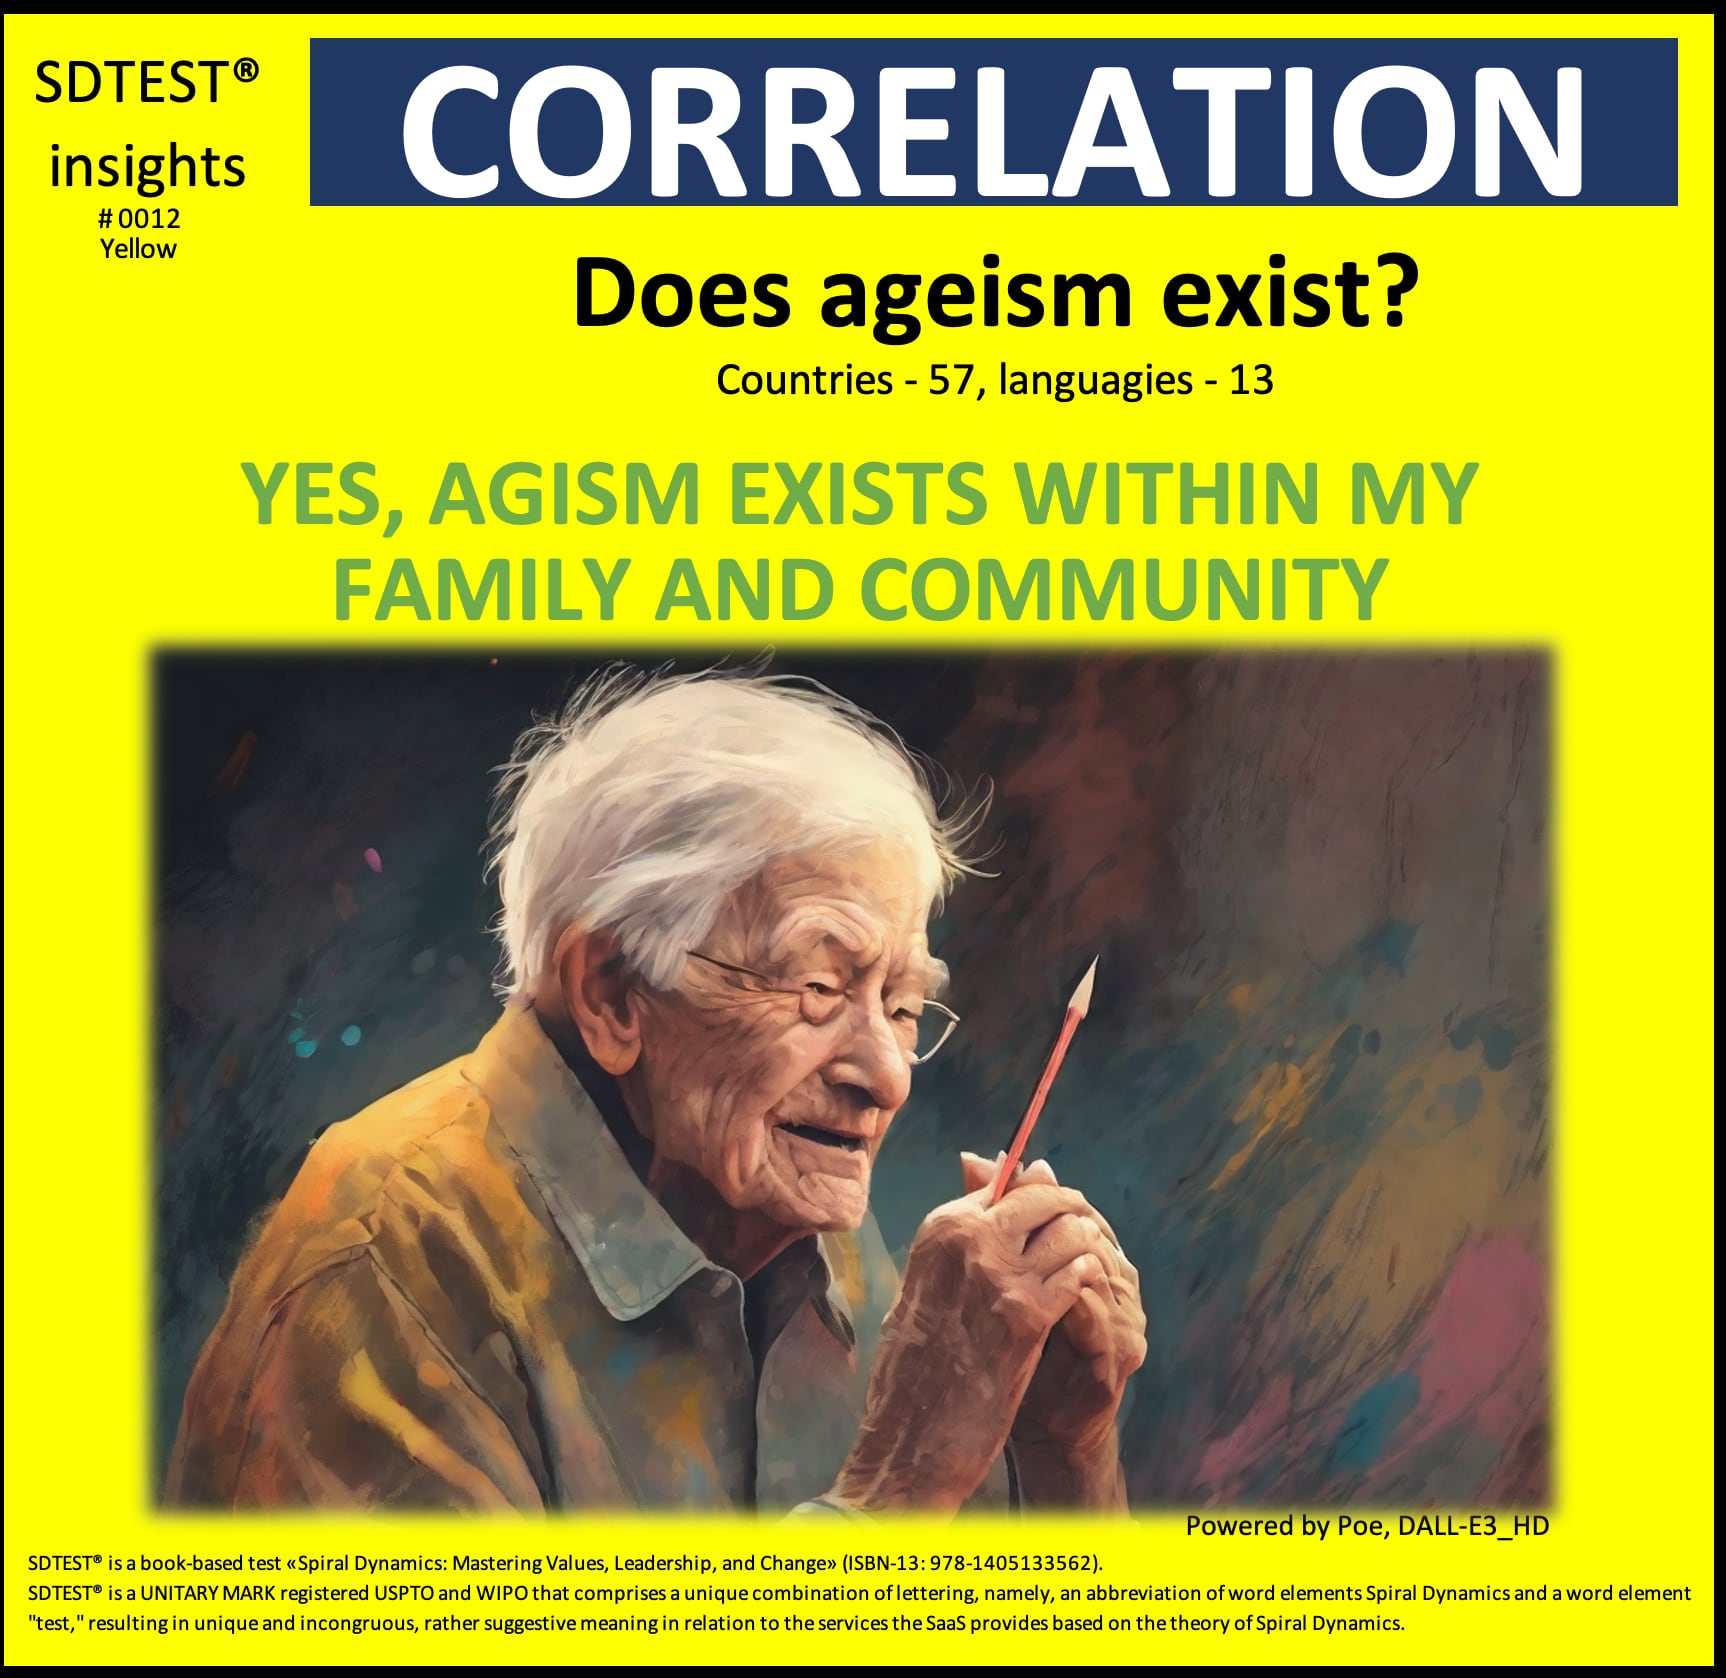
Exploring assumptions about a positive correlation of 0.1171 between the belief in ageism within family/community and the Yellow stage in Spiral Dynamics can be enlightening. Here are some speculative considerations:
0.1121 between the Yes, the organization benefits from having a working group to keep the conversation on ageism and Turquoise stage.
The critical value of the correlation coefficient for a normal distribution, by William Sealy Gosset (Student) r = 0.0889. This positive correlation of 0.1121 meets the reliability criteria but does not necessarily imply causation.
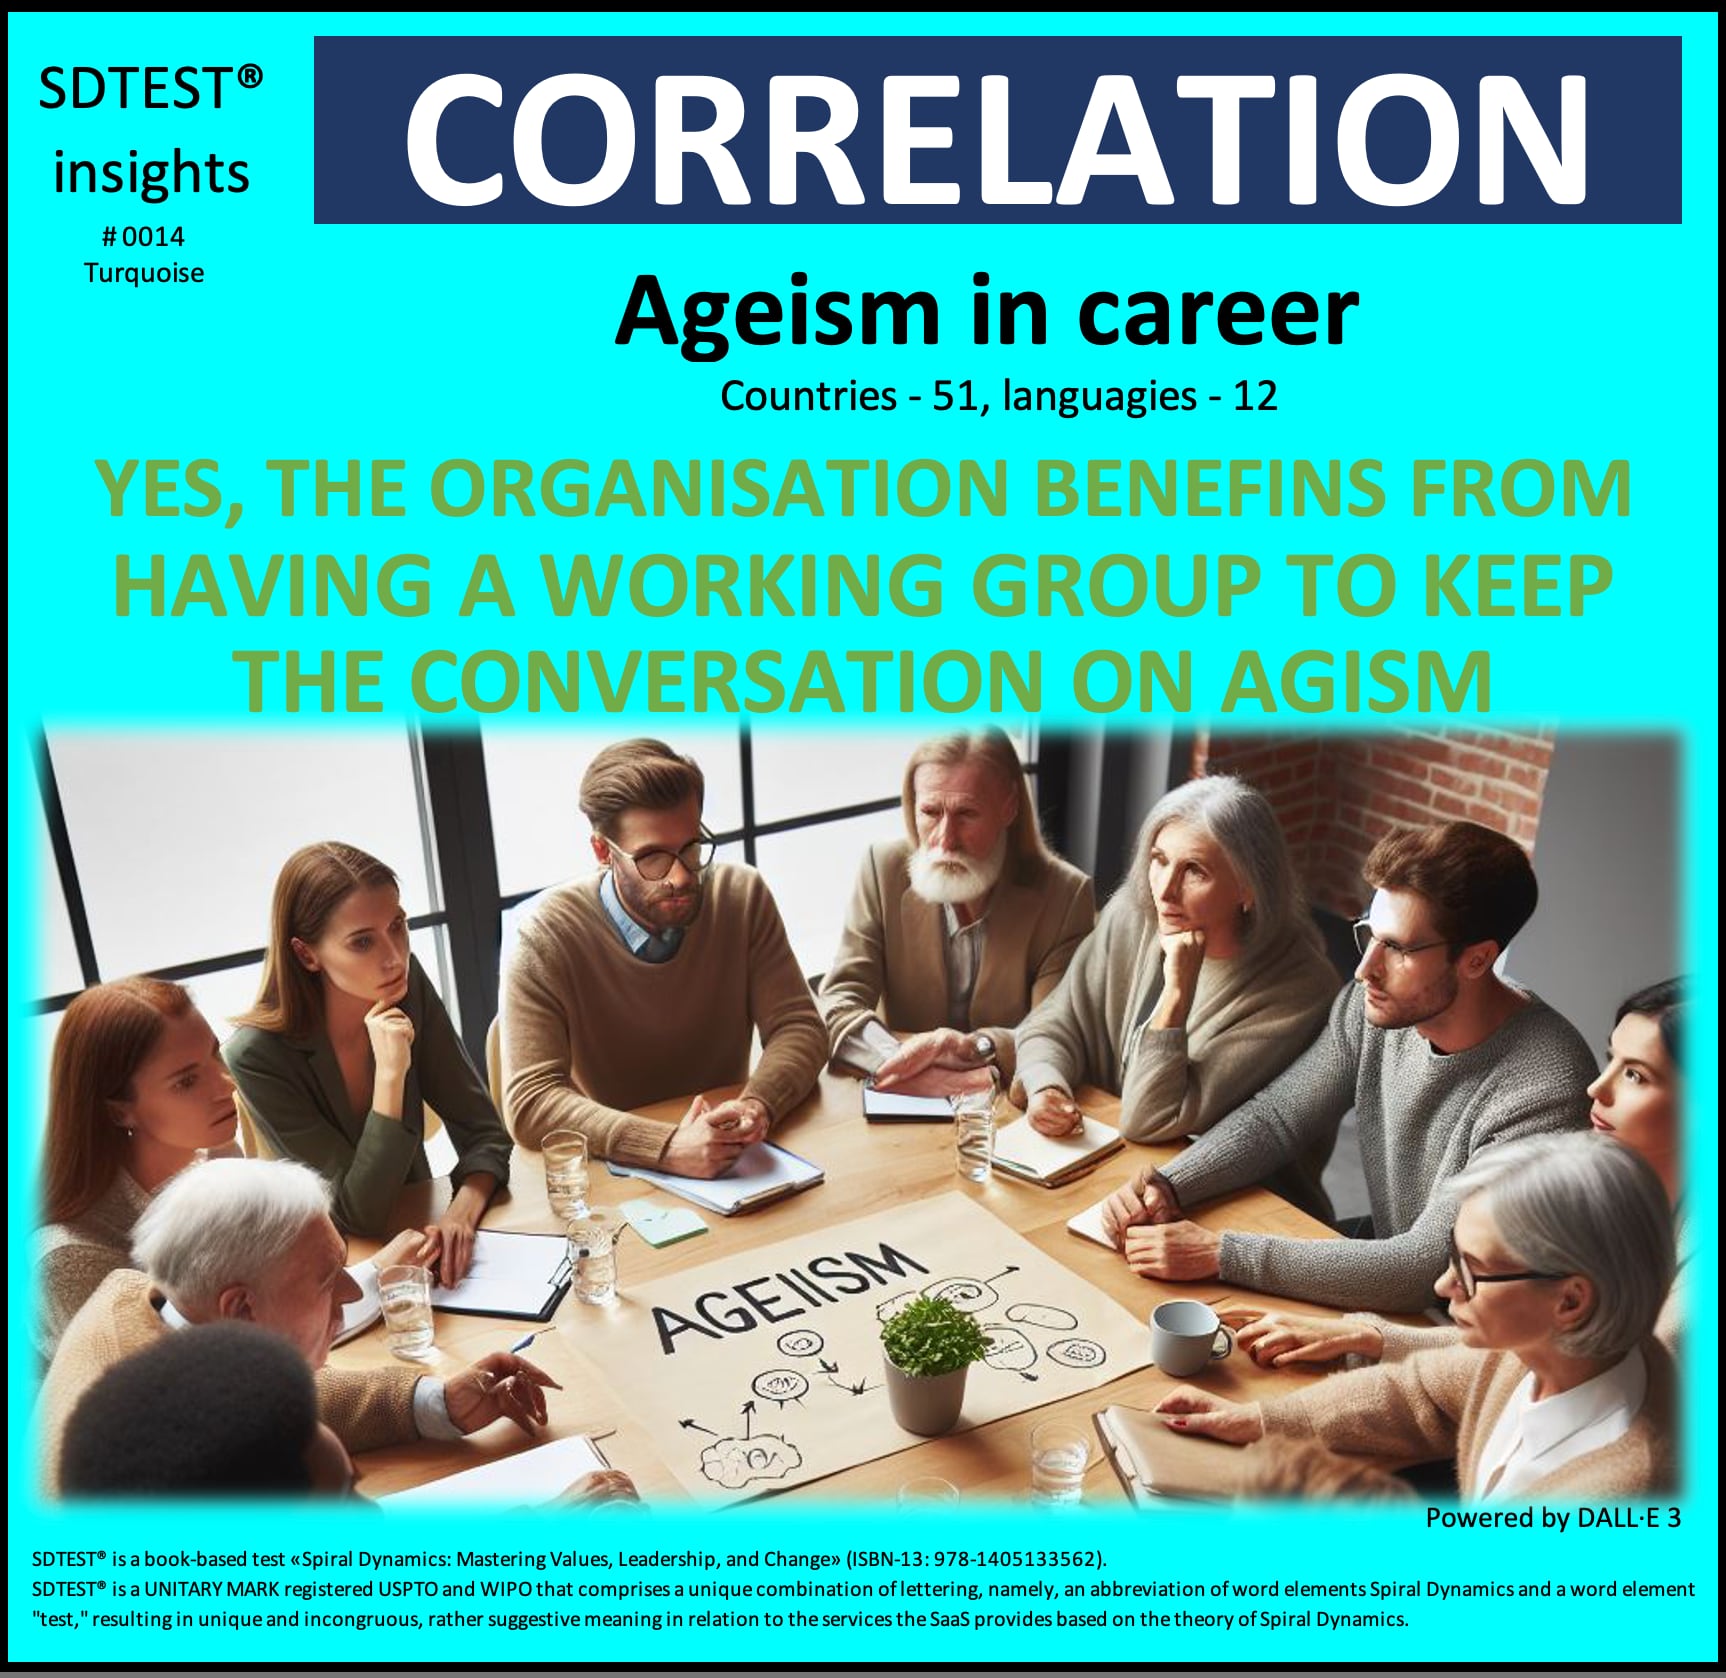
The positive correlation of 0.1121 aligns with the Turquoise vMeme, emphasizing the interdependence of human and natural systems. This suggests that individuals at the Turquoise stage may recognize the value of addressing ageism within an organizational context, viewing it through the lens of sustainability and harmony with the natural world.
In the Turquoise worldview, there's a deep understanding of the interconnectedness of all things. This correlation may indicate a broader concern for the well-being of both individuals and the organization, reflecting a desire for inclusiveness, diversity, and a holistic approach to societal issues.
What insights do you gain from today's correlation? How might we study this relationship more carefully before deducing causation? We welcome respectful and wise perspectives!
Stay tuned every week as we share more results and insights.
After login or registration, free access to the poll results in the FAQ section.
