SDTEST® has 33 different VUCA polls that calculate the 12,299 correlation values between stages of development according to the theory of Spiral Dynamics and answer options of these 33 polls.
We invite curiosity about the systemic mechanisms behind this correlation. There may be hidden variables that provide alternative explanations.
0.1309 between the Marriage and the Purple stage.
The critical value of the correlation coefficient for a normal distribution, by William Sealy Gosset (Student) r = 0.1243. This positive correlation of 0.1309 meets the reliability criteria but does not necessarily imply causation.
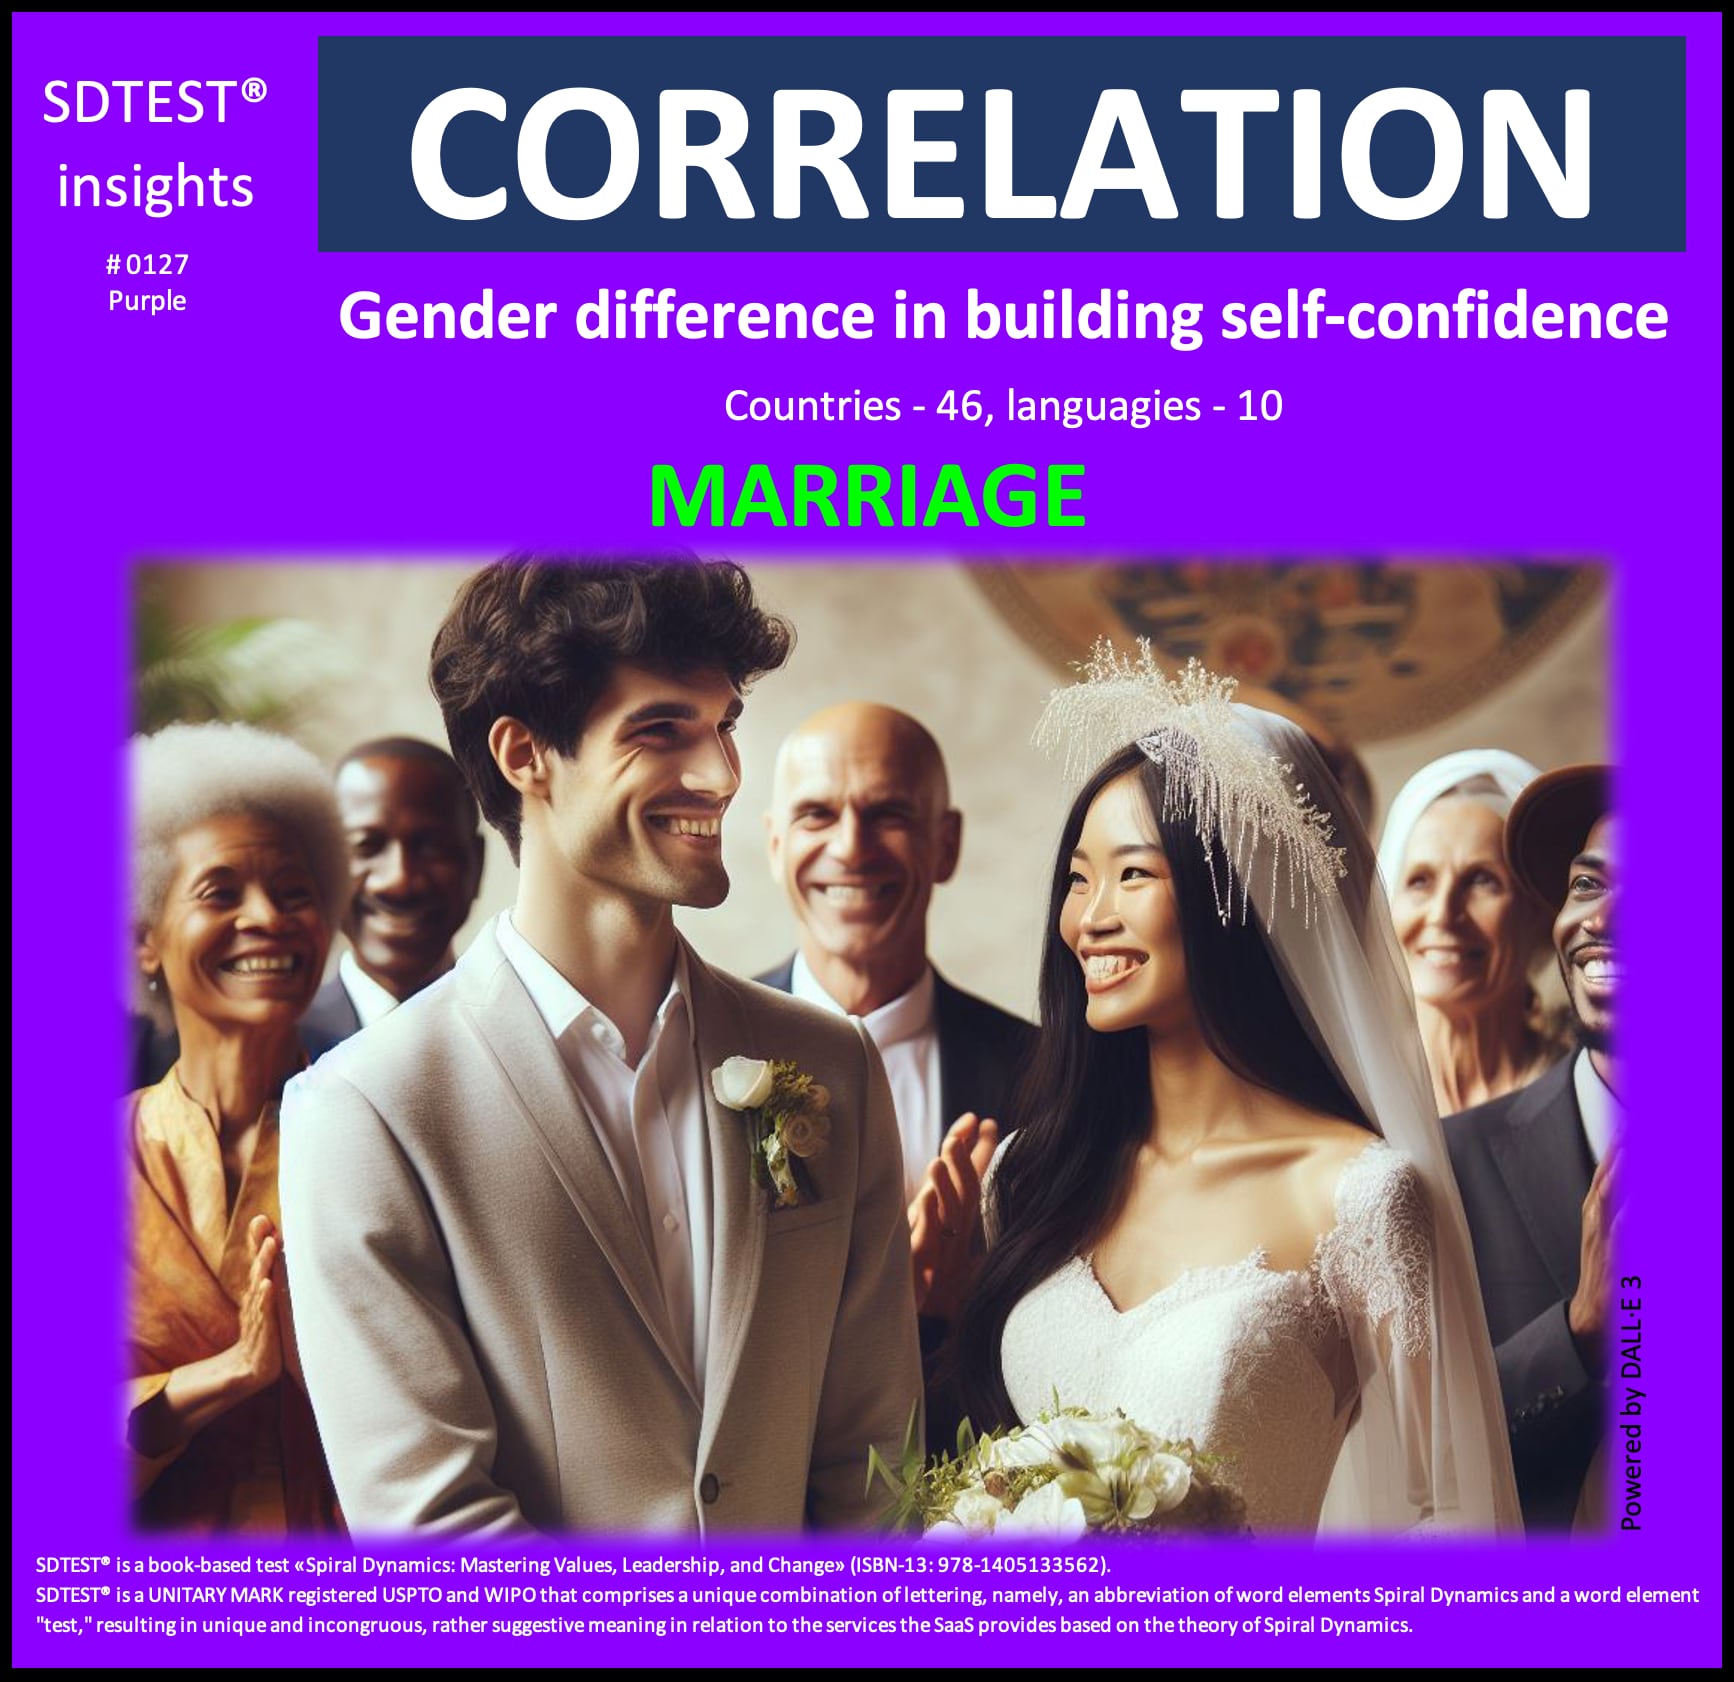
This positive correlation of 0.1309 suggests that within the context of the Purple value system, traditional family structures and gender roles are highly valued and may be seen as an essential aspect of personal and community identity. It could be explained from three points of view:
1. Companies operating within the Purple value system:
Companies operating within the Purple value system would likely view the positive correlation between marriage and the Purple stage as a reflection of the importance placed on traditional family structures and gender roles. These companies may prioritize policies and practices that support the traditional nuclear family, such as offering benefits for spouses and children. They may be more likely to promote individuals who conform to these traditional gender norms. The emphasis on community, tradition, and the influence of authority figures within the Purple value system may also lead these companies to value long-term employee loyalty and adherence to established hierarchies.
2. Teams operating within the Purple value system:
Within teams operating in the Purple value system, the positive correlation between marriage and the Purple stage may indicate a preference for team members with a strong sense of community and belonging and a respect for traditional gender roles and family structures. These teams may be more likely to value team members who are married and have a stable family life, as this aligns with the Purple value system's emphasis on the importance of the group and the influence of traditional authority figures. The team dynamic may also be characterized by solid loyalty, adherence to established rituals and taboos, and a reluctance to challenge the status quo.
3. Individuals within the Purple value system:
For individuals operating within the Purple value system, the positive correlation between marriage and the Purple stage may reflect a deep-seated belief in the importance of traditional family structures and gender roles. These individuals may view marriage as a fundamental aspect of their identity and a key part of their sense of belonging to the larger community. They may be more likely to seek out partners who conform to these traditional gender norms and may place a high value on the stability and security that come with a long-term, committed relationship. The influence of traditional authority figures, such as religious or community leaders, may also significantly shape these individuals' attitudes toward marriage and family.
In our analysis of the poll "Reasons why people give up," we found an intriguing positive correlation that warrants closer examination:
0.1163 between the Feel the World owes them something and the Red stage.
The critical value of the correlation coefficient for a normal distribution, by William Sealy Gosset (Student) r = 0.0595. This positive correlation of 0.1163 meets the reliability criteria but does not necessarily imply causation.
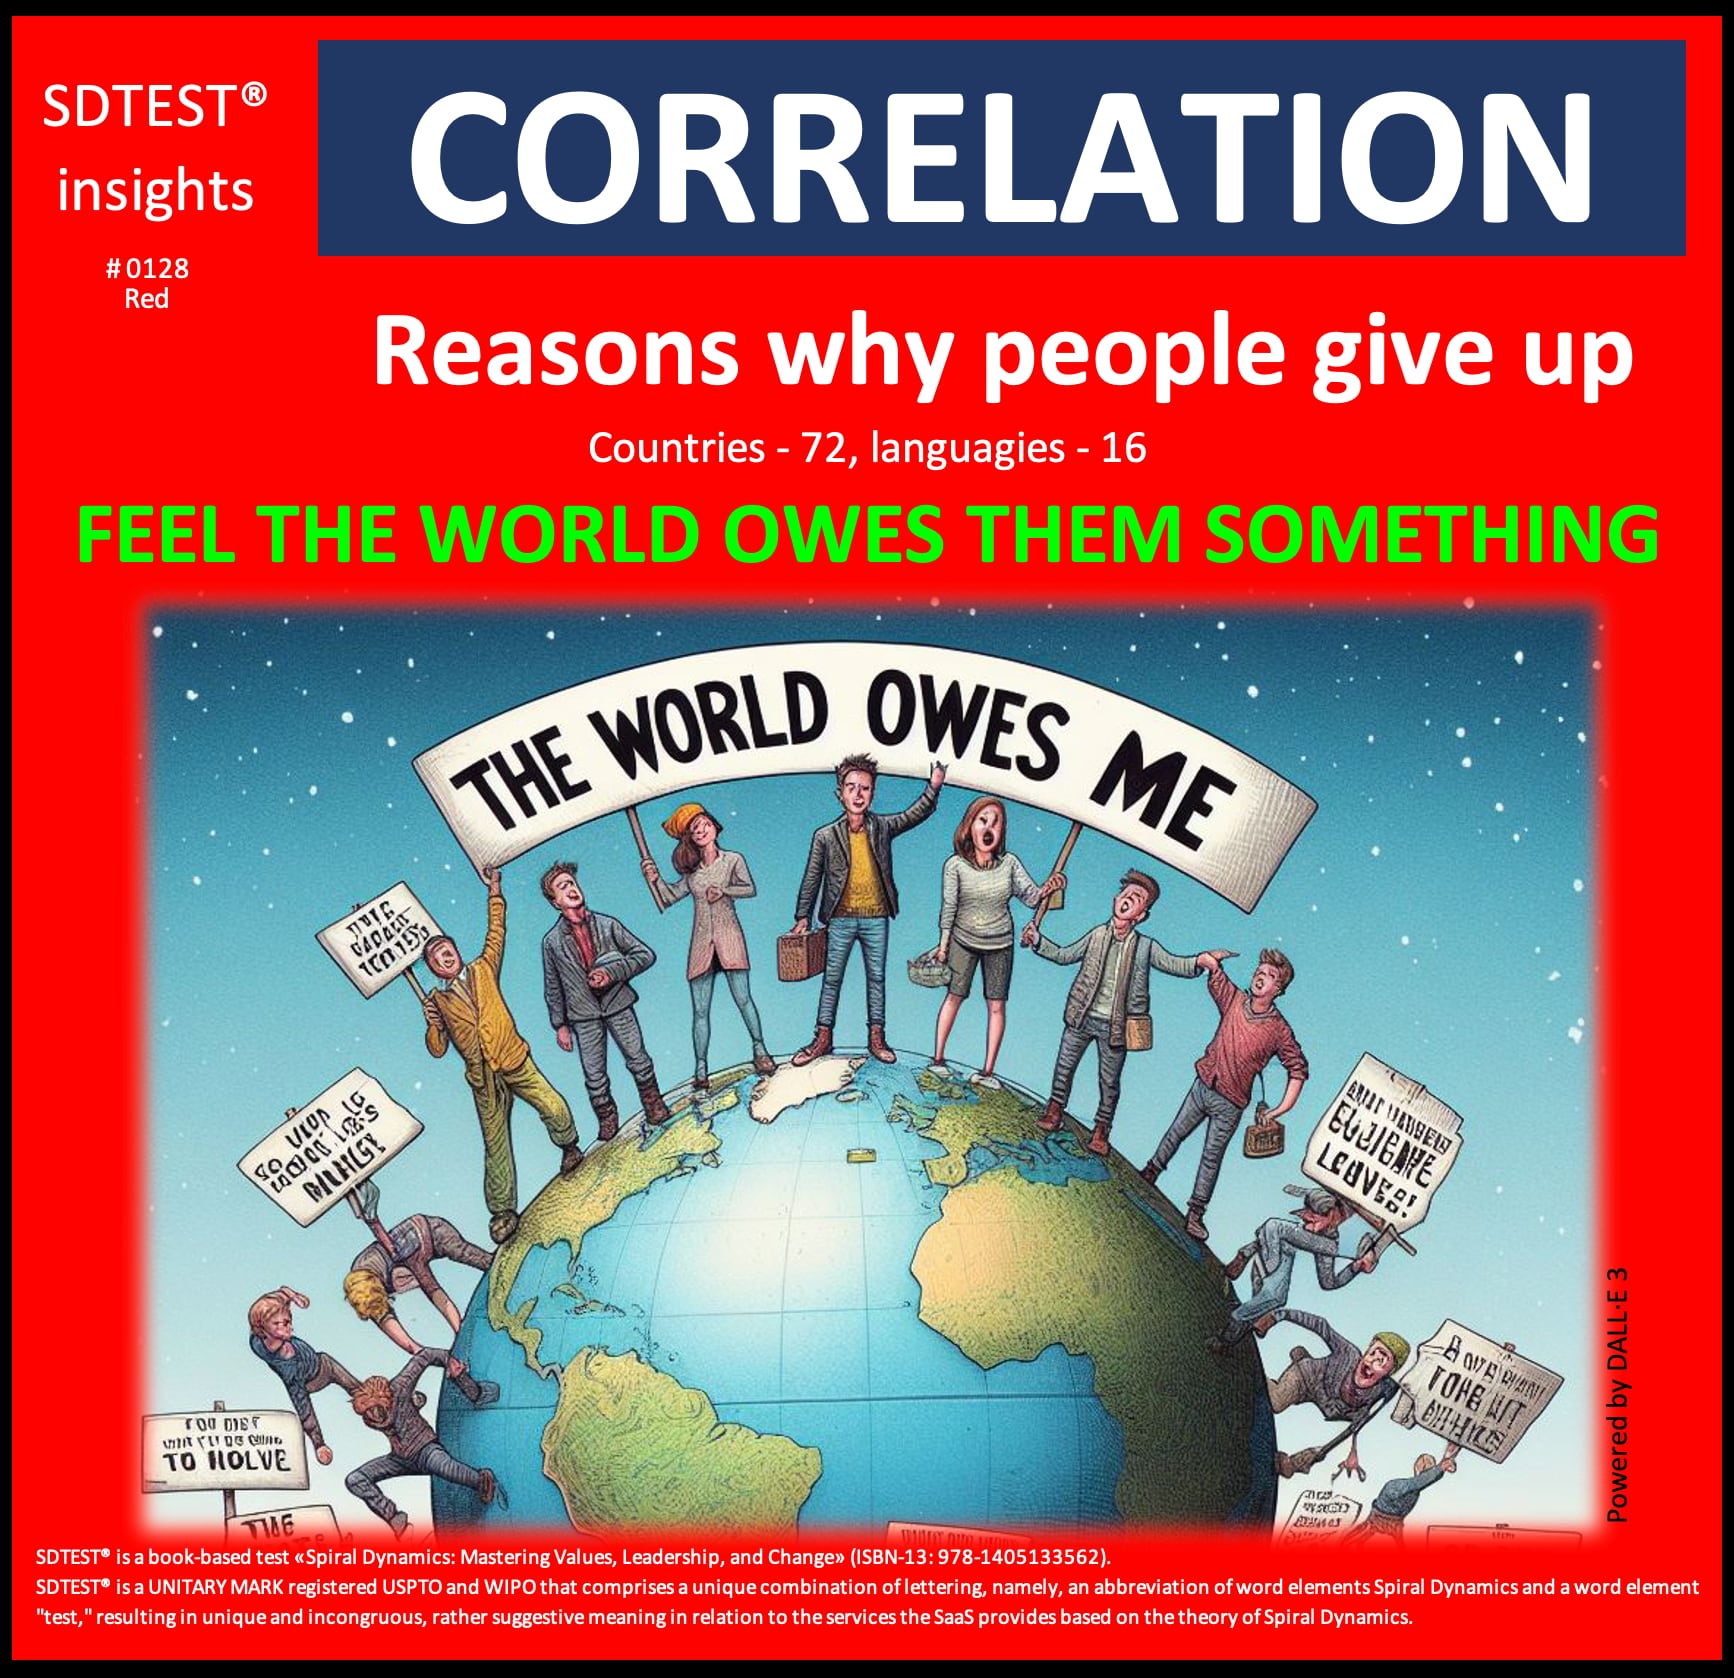
This positive correlation of 0.1163 suggests that individuals in the Red value system may be more susceptible to giving up when they feel that the world has not lived up to their expectations or provided them with the recognition or rewards they believe they deserve. It could be explained from three points of view:
1. Companies operating within the Red value system:
Companies operating within the Red value system may view this positive correlation as indicating that individuals in the Red stage are more likely to give up when they feel that the world owes them something. These companies may be inclined to foster an environment that encourages a sense of personal responsibility and accountability rather than a sense of entitlement. They may prioritize initiatives that empower employees to take ownership of their success and growth rather than relying on external factors or perceived obligations from the world.
2. Teams operating within the Red value system:
Within teams operating in the Red value system, the positive correlation may suggest that team members in the Red stage are more likely to give up when they feel that the world owes them something.. This could lead to a team dynamic where individuals focus more on asserting their needs and demands rather than working collaboratively to overcome difficulties. Team leaders may need to emphasize the importance of personal accountability and a willingness to persevere rather than succumbing to a sense of entitlement.
3. Individuals within the Red value system:
For individuals operating within the Red value system, the positive correlation may indicate a tendency to give up when they feel that the world has not given them the recognition, rewards, or opportunities they believe they deserve. These individuals may be more inclined to blame external factors for their failures rather than take responsibility for their actions and decisions. Overcoming this mindset may require a shift towards a greater sense of personal agency and a willingness to put in the hard work necessary to achieve their goals rather than relying on a perceived sense of entitlement.
In our analysis of the poll "A.I. and the end of Civilization (Elon Musk)," we found an intriguing positive correlation that warrants closer examination:
0.1045 between the Artificial intelligence is dangerous to human civilization / Strongly agree and the Blue stage.
The critical value of the correlation coefficient for a normal distribution, by William Sealy Gosset (Student) r = 0.0852. This positive correlation of 0.1045 meets the reliability criteria but does not necessarily imply causation.

This positive correlation of 0.1045 highlights the potential tension between the values and beliefs associated with the Blue value system and the rapid technological advancements that are transforming our world. Understanding these dynamics can help organizations and individuals navigate the challenges and opportunities presented by emerging technologies while respecting the importance of traditional values and social structures. It could be explained from three points of view:
1. Companies operating within the Blue value system:
Companies operating within the Blue value system would likely view the positive correlation as an indication of the importance placed on order, rules, and traditional ways of doing things. These companies may be more inclined to view technological advancements like AI as potentially threatening the established social and moral order. They may be more likely to implement strict policies and procedures to regulate the development and use of AI, prioritizing the preservation of traditional values and hierarchical structures over the potential benefits of technological progress.
2. Teams operating within the Blue value system:
Within teams operating in the Blue value system, the positive correlation may suggest a tendency to view AI as a disruptive force that must be carefully controlled and monitored. Team members may be more likely to adhere to a strict set of rules and protocols when it comes to the use of AI and may be resistant to any changes or innovations that could be perceived as a threat to the established order. This could lead to a team dynamic with a strong emphasis on conformity, obedience, and a reluctance to challenge the status quo, even in the face of technological advancements.
3. Individuals within the Blue value system:
For individuals operating within the Blue value system, the positive correlation may reflect a deep-seated belief in the importance of traditional values, moral codes, and the authority of higher powers. These individuals may view AI as a potential threat to the established social and religious order and may be more inclined to see it as a force that could undermine the traditional ways of life that they hold dear. They may be more likely to trust in the wisdom and guidance of established institutions and authorities rather than embrace the potential benefits of technological innovation.
In our analysis of the poll "My Greatest Fears," we found an intriguing positive correlation that warrants closer examination:
0.0865 between the Illness of relatives, children, and the Orange stage.
The critical value of the correlation coefficient for a normal distribution, by William Sealy Gosset (Student) r = 0.0354. This positive correlation of 0.0865 meets the reliability criteria but does not necessarily imply causation.
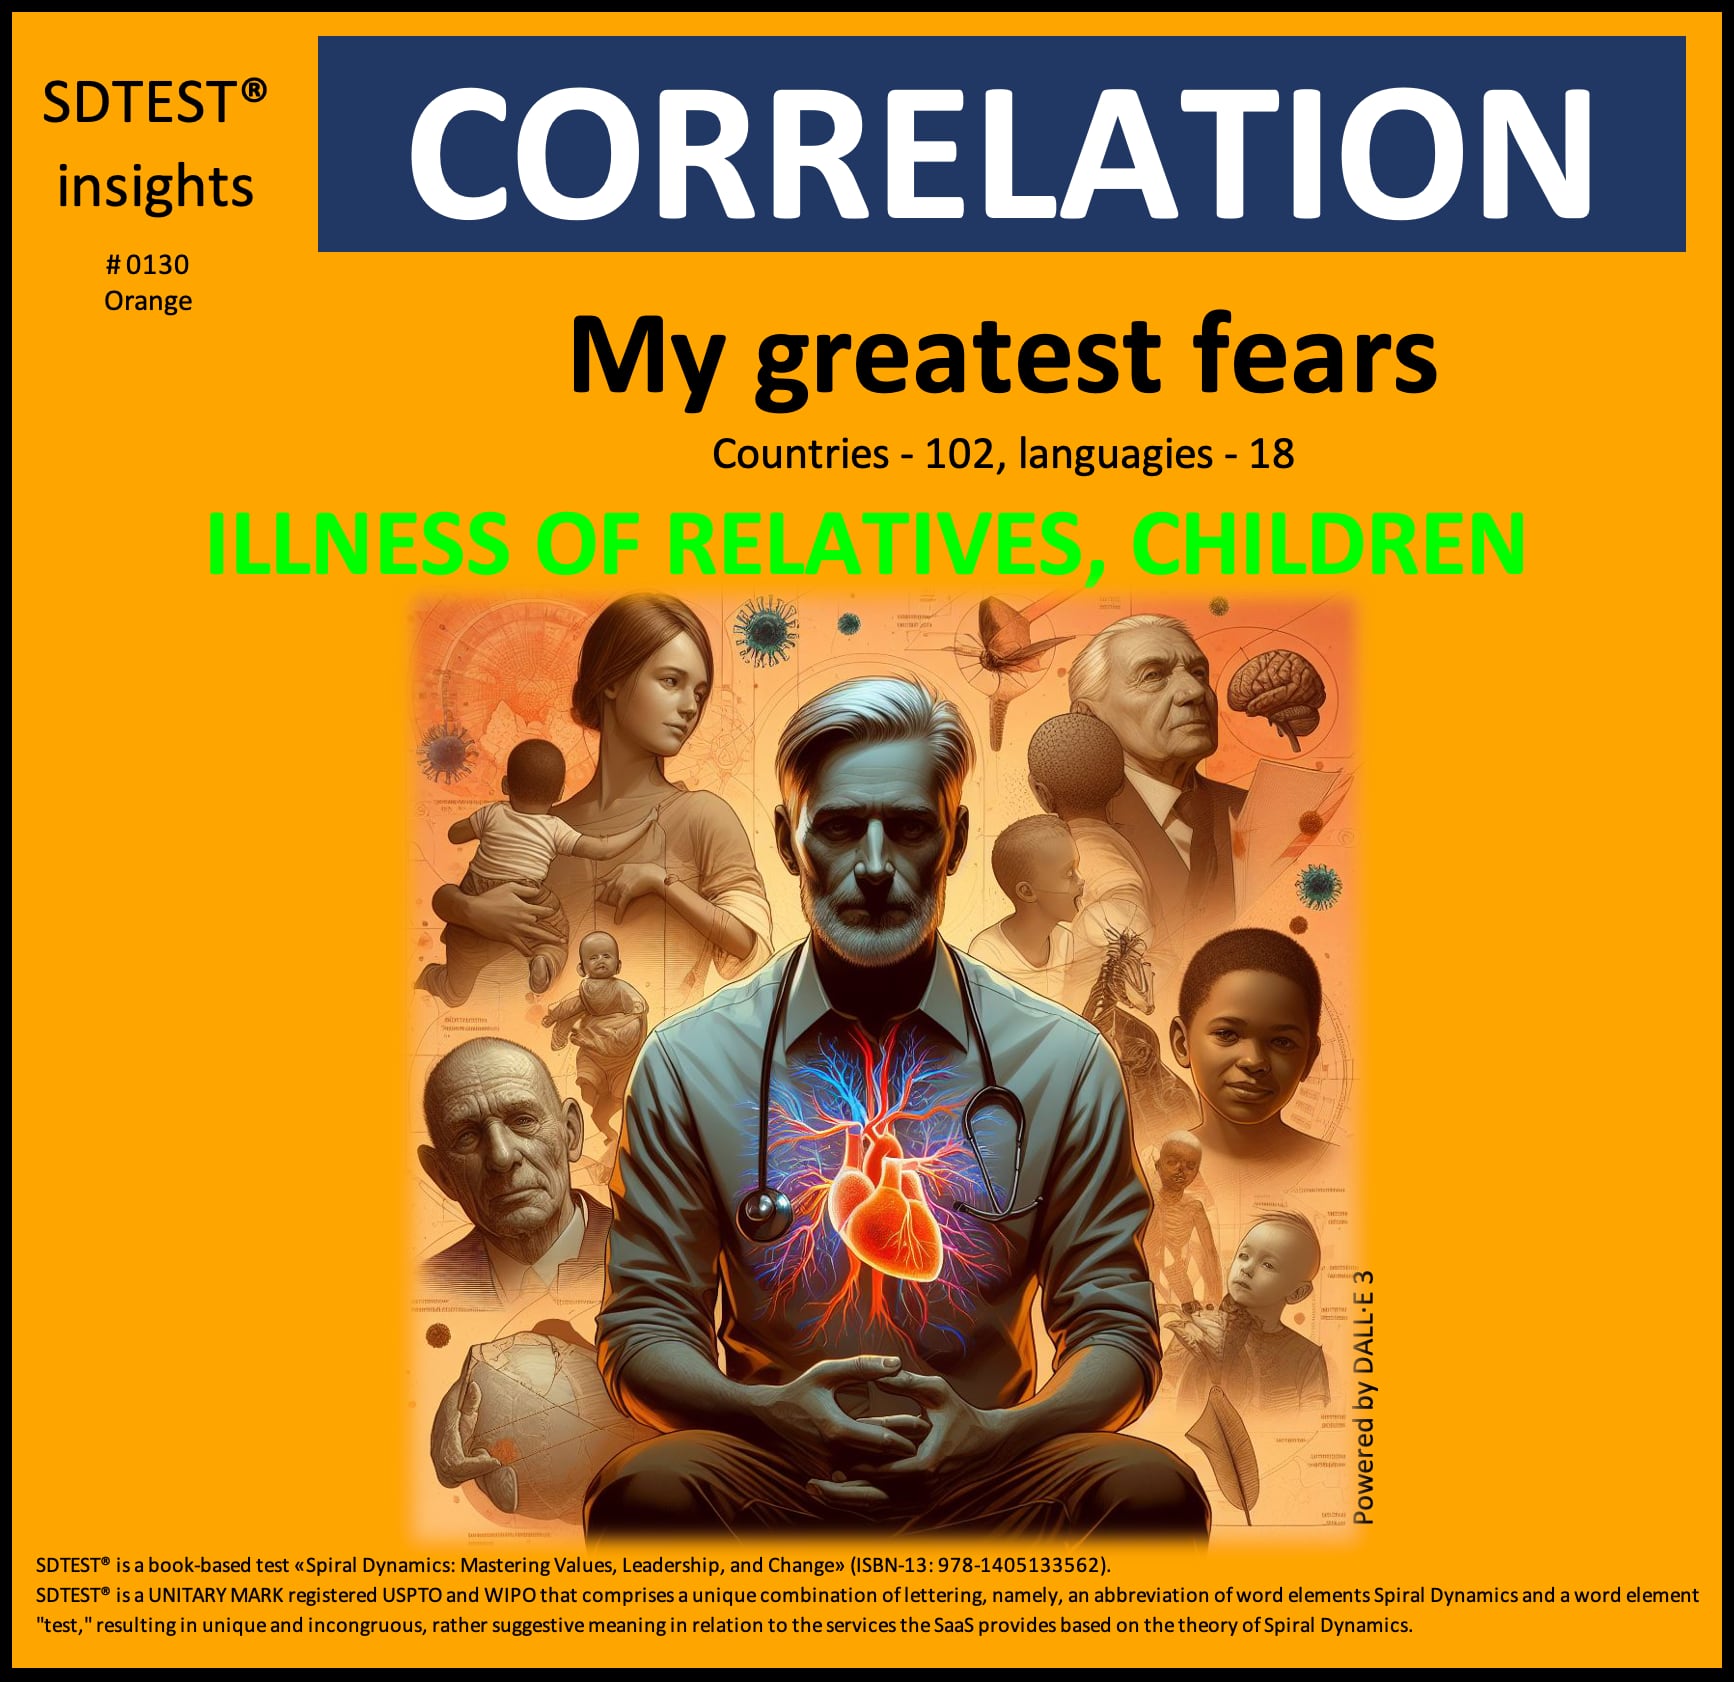
This positive correlation of 0.0865 highlights the importance that individuals, teams, and companies operating within the Orange value system place on health, well-being, and applying scientific methods to address challenges. This insight can help inform strategies and initiatives to promote organizations' and individuals' overall health and productivity within the Orange value system. It could be explained from three points of view:
1. Companies operating within the Orange value system:
Companies operating within the Orange value system would likely view the positive correlation as an indication of the importance placed on rational, logical thinking and applying scientific methods to address challenges. These companies may be more inclined to invest in research and development to find innovative solutions to health-related issues, such as improving medical treatments or developing preventative measures. They may also prioritize the well-being of their employees and their families, recognizing that the health and productivity of their workforce are crucial to achieving their business objectives.
2. Teams operating within the Orange value system:
Within teams operating in the Orange value system, the positive correlation may suggest a heightened awareness and concern for the health and well-being of team members and their families. Team members may be more likely to collaborate on finding practical, evidence-based solutions to address health-related challenges, drawing on their analytical and problem-solving skills. This could foster a team dynamic where there is a strong emphasis on using data and scientific methods to identify and mitigate potential health risks, with the ultimate goal of ensuring the overall well-being and productivity of the team.
3. Individuals within the Orange value system:
For individuals operating within the Orange value system, the positive correlation may reflect a deep-seated concern for the health and well-being of their loved ones. These individuals may be more likely to approach health-related issues rationally and analytically, seeking the latest scientific research and medical advancements to ensure the best possible outcomes. They may also be more inclined to take proactive measures to maintain their health and the health of their family members, viewing it as a crucial aspect of their personal and professional success.
In our analysis of the poll "What makes people successful at work?" we found an intriguing negative correlation that warrants closer examination:
-0.0464 between the Adaptability to Change and the Green stage.
The critical value of the correlation coefficient for a normal distribution, by William Sealy Gosset (Student) r = 0.0419. This negative correlation of -0.0464 meets the reliability criteria but does not necessarily imply causation.
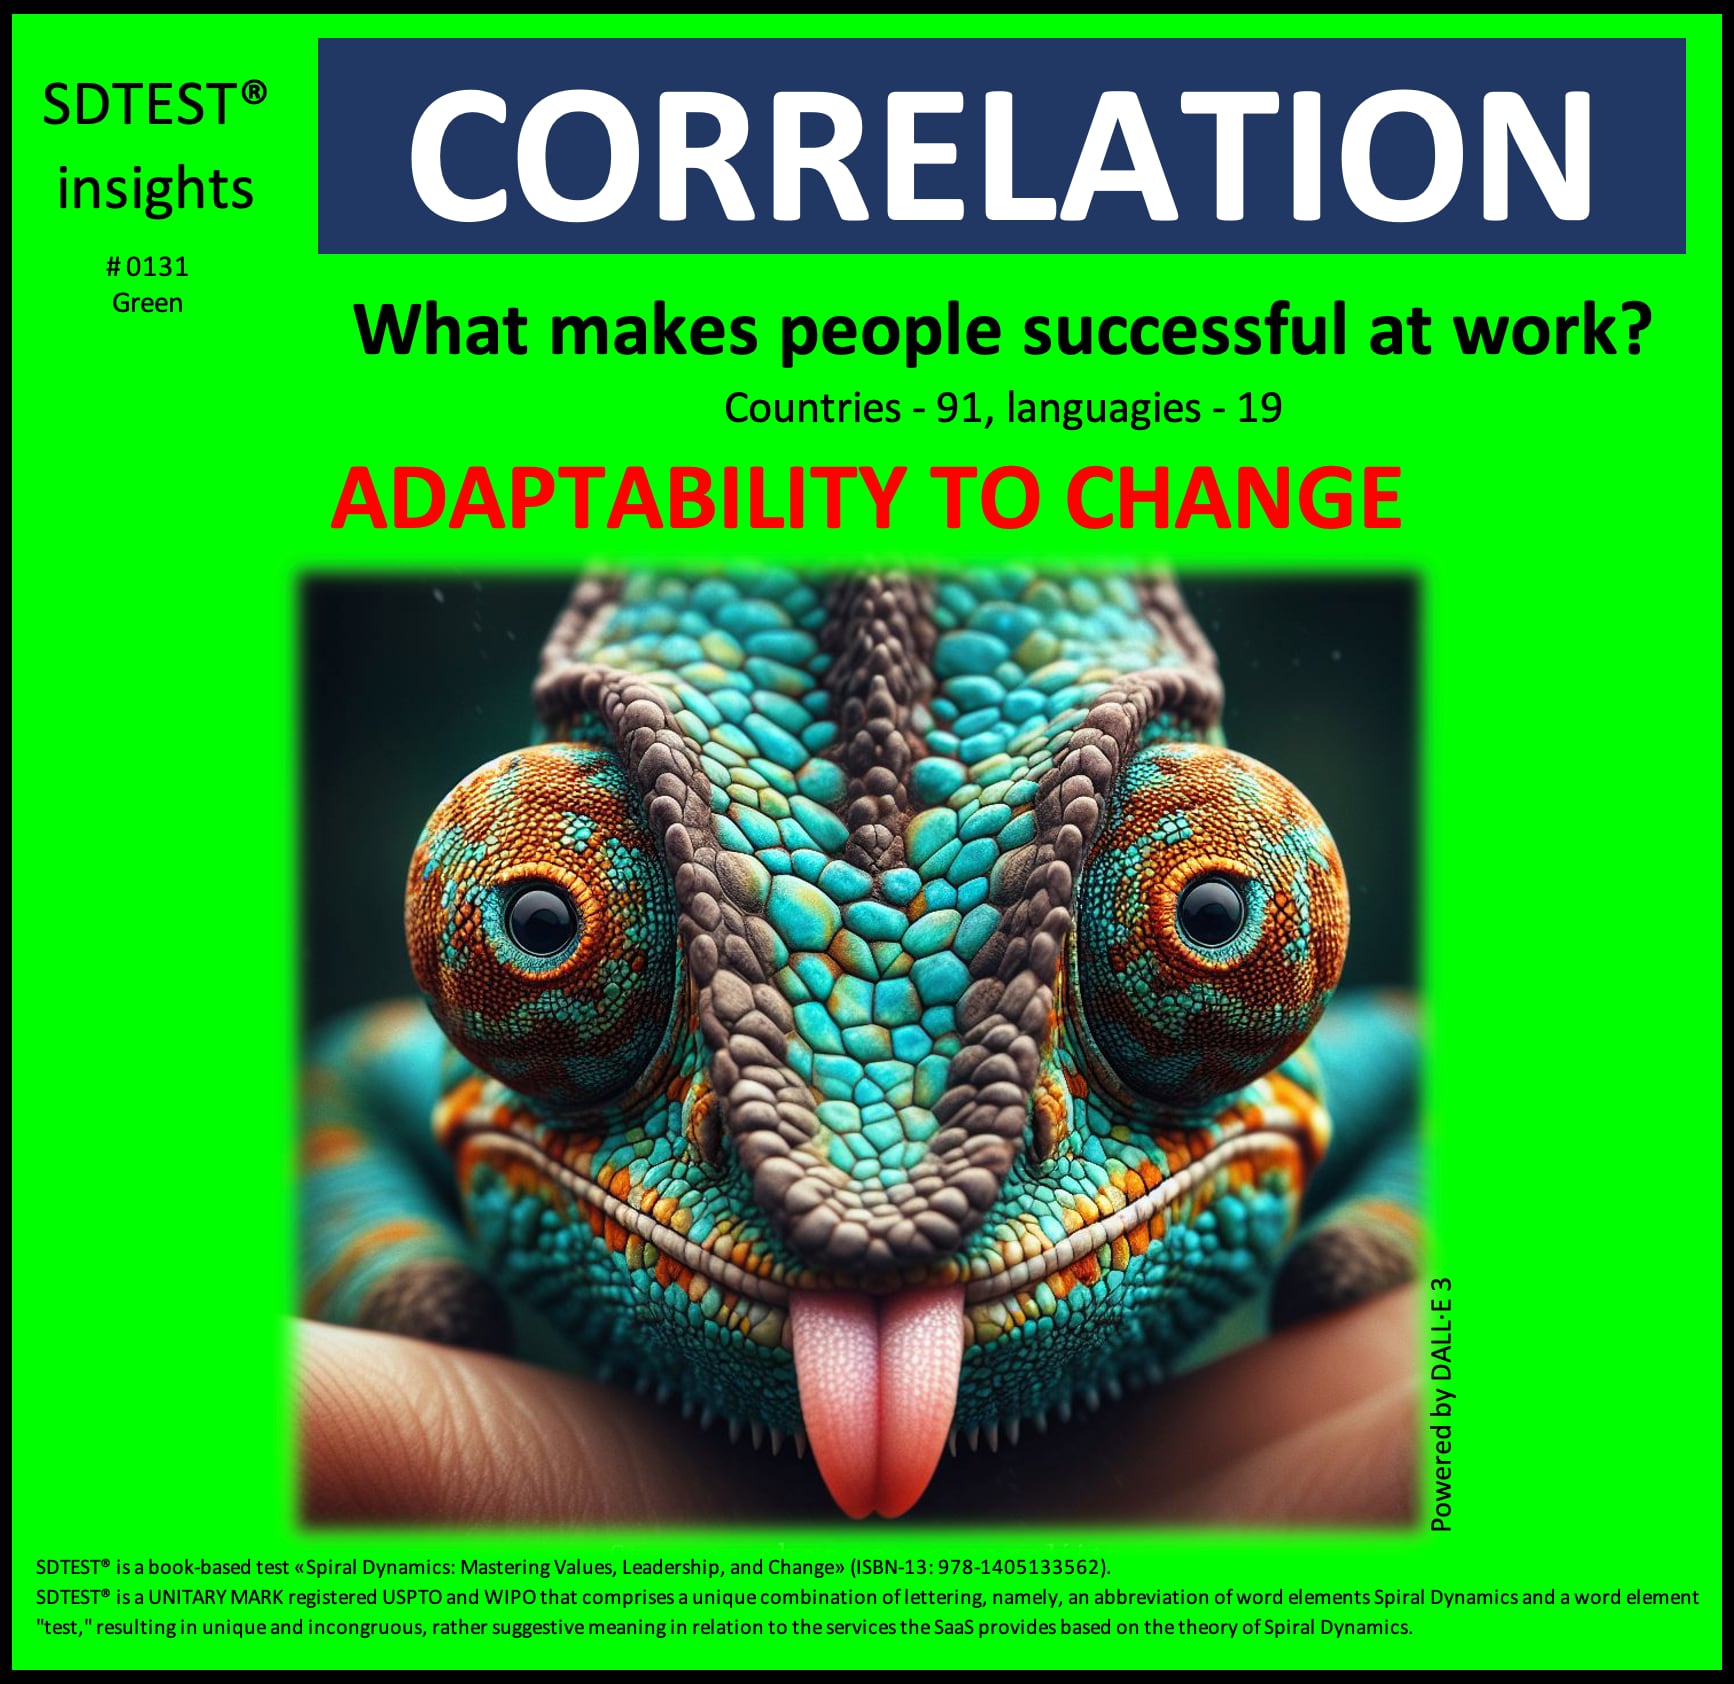
This negative correlation of -0.0464 suggests that a stronger affinity with Green values could coincide with a lower capacity for adaptability. It could be explained from three points of view:
1. Companies operating within the Green value system:
This negative correlation suggests that companies deeply aligned with the Green value system may face challenges in fostering adaptability to change within their organizations. While our commitment to community, ecology, and holistic thinking is admirable, the inverse association with adaptability could hinder our ability to evolve and respond to market shifts promptly. As a Green-oriented company, we must be mindful of this potential obstacle and actively cultivate an environment that harmonizes our core values with a capacity for strategic transformation. Embracing inclusive decision-making processes, cross-functional collaboration, and continuous learning can help us maintain our ethical principles while developing the agility to navigate an ever-changing business landscape successfully.
2. Teams operating within the Green value system:
For teams operating within the Green mindset, this negative correlation between adaptability and our values could manifest as resistance to change or an over-attachment to established processes. While unity, cooperation, and sustainability are paramount, the inverse relationship with adaptability may cause our team to struggle with pivoting strategies or implementing new initiatives swiftly. To counteract this tendency, we must foster an open dialogue that welcomes diverse perspectives, encourages respectful dissent, and celebrates innovation. By strengthening our systems-thinking capabilities and promoting a growth mindset, our team can develop the resilience to embrace change proactively while upholding our commitment to ethical, community-focused practices.
3. Individuals within the Green value system:
As someone deeply invested in the Green worldview, I must be cognizant of this negative correlation, which suggests that a stronger affinity for our values could coincide with a lower capacity for adaptability. My holistic approach to life and concern for the greater good may inadvertently contribute to a reluctance to change or evolve personal practices. To mitigate this potential challenge, I must actively nurture a mindset of lifelong learning, self-reflection, and a willingness to step outside my comfort zone. By continually expanding my perspectives, seeking out diverse experiences, and remaining open to personal growth opportunities, I can maintain my authentic connection to Green principles while developing the flexibility to adapt to life's inevitable changes gracefully.
0.0830 between the Be physically active and the Yellow stage.
The critical value of the correlation coefficient for a normal distribution, by William Sealy Gosset (Student) r = 0.0702. This positive correlation of 0.0830 meets the reliability criteria but does not necessarily imply causation.

This positive correlation of 0.0830 suggests that within the Yellow value system, there is a recognition of the holistic benefits of physical activity for individual and organizational well-being. It could be explained from three points of view:
1. Companies operating within the Yellow value system:
Companies operating within the Yellow value system would likely view the positive correlation as an indication of the importance of holistic well-being and personal growth. These companies may recognize that supporting and encouraging physical activity among their employees is about physical health and fostering mental, emotional, and cognitive well-being. They may implement comprehensive wellness programs that integrate physical, mental, and spiritual practices, understanding that a multifaceted approach to self-care is essential for the development and thriving of their workforce.
2. Teams operating within the Yellow value system:
Within teams operating in the Yellow value system, the positive correlation may suggest a shared understanding of the interconnectedness between physical activity and overall well-being. Team members may be more likely to support and encourage each other to engage in regular physical activity, recognizing that it can enhance their ability to navigate the complexities of their work and personal lives. This team dynamic may foster a culture of mutual care, where individuals feel empowered to prioritize their holistic well-being, knowing that it will benefit not only themselves but also the collective success of the team.
3. Individuals within the Yellow value system:
For individuals operating within the Yellow value system, the positive correlation may reflect a deep appreciation for the role of physical activity in personal growth and development. These individuals may view physical activity as cultivating self-awareness, enhancing cognitive function, and fostering a sense of balance and integration between their lives' physical, mental, and spiritual aspects. They may be more inclined to engage in various physical practices, from exercise to mindfulness-based activities, as part of their journey of self-discovery and transcendence.
In our analysis of the poll "What makes a boss a great leader?" we found an intriguing negative correlation that warrants closer examination:
-0.0467 between the Trustworthiness and the Turquoise stage.
The critical value of the correlation coefficient for a normal distribution, by William Sealy Gosset (Student) r = 0.0444. This negative correlation of -0.0467 meets the reliability criteria but does not necessarily imply causation.

This negative correlation of -0.0467 suggests that within the Turquoise value system, the definition of great leadership extends beyond the traditional notions of trustworthiness. Companies, teams, and individuals operating within this value system may be more inclined to seek leaders who can foster a holistic, integrated, and ecological perspective, even if they do not necessarily fit the mold of a "trustworthy" leader.
1. Companies operating within the Turquoise value system:
The negative correlation suggests that companies operating within the Turquoise value system may better understand what makes a great leader. While trustworthiness is generally considered desirable, the Turquoise-aligned company may recognize that authentic leadership goes beyond simply being trustworthy. They may prioritize leaders who can foster a holistic, integrated, and ecological perspective - leaders who can see the interconnectedness of all things and make decisions considering the well-being of both people and the planet. These companies may be more inclined to value leaders who exhibit compassion, empathy, and a deep commitment to sustainability, even if they do not necessarily fit the traditional mold of a "trustworthy" leader.
2. Teams operating within the Turquoise value system:
Within teams operating in the Turquoise value system, the negative correlation may indicate a preference for leaders who can transcend the traditional notions of trustworthiness and embody a more expansive, systems-thinking approach. Team members may be more drawn to leaders who can help them recognize human and natural systems' interdependence and guide the team toward solutions that promote harmony, diversity, and inclusiveness. This team dynamic may foster an environment where open communication, shared decision-making, and a willingness to consider multiple perspectives are valued more highly than a leader's trustworthiness.
3. Individuals within the Turquoise value system:
For individuals operating within the Turquoise value system, the negative correlation may reflect a deeper understanding of the complexity of leadership and the importance of holistic, integrative thinking. These individuals may be less concerned with traditional measures of trustworthiness and more focused on finding leaders who can help them navigate the interconnected challenges of the modern world. They may be drawn to leaders who exhibit a strong sense of compassion, a deep connection to the natural world, and a commitment to sustainable, long-term solutions that benefit both people and the planet.
What insights do you gain from today's correlation? How might we study this relationship more carefully before deducing causation?
We welcome respectful and wise perspectives! Stay tuned every week as we share more results and insights.
After login or registration, free access to the poll results in the FAQ section.
2024.05.12
FearpersonqualitiesprojectorganizationalstructureRACIresponsibilitymatrixCritical ChainProject Managementfocus factorJiraempathyleadersbossGermanyChinaPolicyUkraineRussiawarvolatilityuncertaintycomplexityambiguityVUCArelocatejobproblemcountryreasongive upobjectivekeyresultmathematicalpsychologyMBTIHR metricsstandardDEIcorrelationriskscoringmodelGame TheoryPrisoner's Dilemma
Valerii Kosenko
Pamilik Produk SaaS SDTEST®
Valerii nduweni kualifikasi minangka pedagogue-psikolog sosial ing 1993 lan wiwit nggunakake kawruh ing manajemen proyek.
Valerii pikantuk gelar Master lan kualifikasi manajer proyek lan program ing 2013. Sajrone program Master, dheweke kenal karo Project Roadmap (GPM Deutsche Gesellschaft für Projektmanagement e. V.) lan Spiral Dynamics.
Valerii punika penulis njelajah kahanan sing durung mesthi saka V.U.C.A. konsep nggunakake Spiral Dynamics lan statistik matematika ing psikologi, lan 38 polling internasional.