buch-basierter Test «Spiral Dynamics:
Mastering Values, Leadership, and
Change» (ISBN-13: 978-1405133562)
Sponsoren

The Tale of the Tall Oak

Once upon a time, there was a tiny oak tree sapling named Peety. Peety dreamed of growing up into a mighty oak tree. 


Each year, Peety grew a little bit taller. He stretched his branches toward the sun and felt his trunk thicken as he grew. 


Over many years, Peety grew from a sapling into a young tree and finally into a tall, mature oak! He was so tall that he could see over the whole forest.


Peety noticed that the other tall oak trees had thick trunks, too. His friend Paul reached high into the sky just like Peety. Paul's trunk was thick and sturdy at the base. 


The small saplings that were sprouting had skinny little trunks. But Peety knew that would change over time as they grew taller.


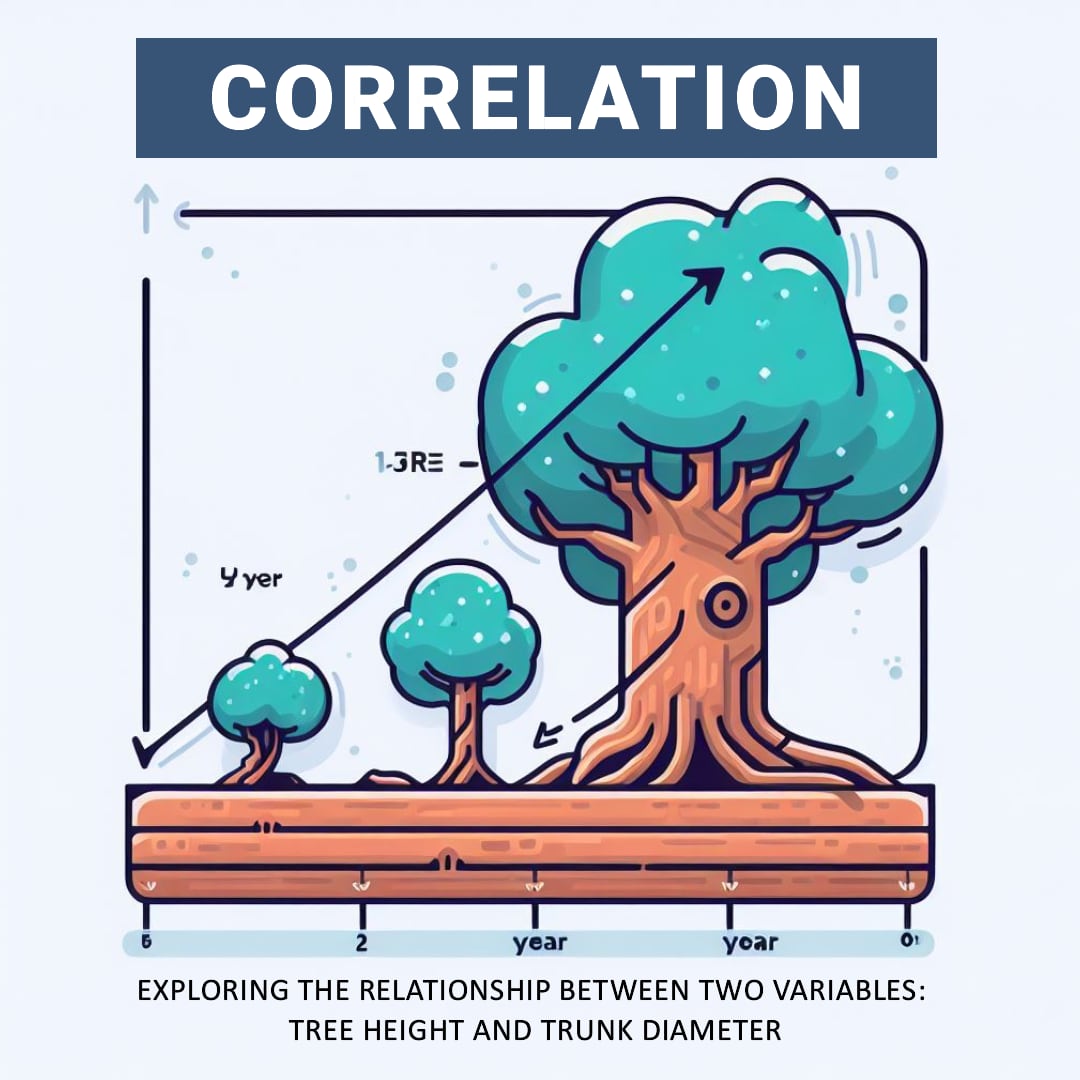
Peety realized that, just like him, the taller an oak tree was, the thicker its trunk became. 


So even though the forest was filled with all different sizes of oak trees, Peety noticed a pattern - a correlation between tree height and trunk width. The tall trees always had thicker trunks, while the small saplings had skinny trunks. This was how pine trees grew strong enough to reach great heights! 


If you record how a tree grows - its height and trunk thickness - and plot it on a picture or graph, then the correlation is when these two things change together. That is, if you see that one is increasing, the other is also increasing, and vice versa.


The SDTEST® gives clues to someone's motivational values. However, additional polls can provide more pieces of the puzzle.


Imagine also giving a "Fears" poll. It asks people to rate different fears from 0 (not scary) to 5 (very scary). 


Now imagine 100 people who took both tests. You could match up each person's SDTEST® colors with their rated fears.


If people high in Blue values feared uncertainty more, that insight ties values to perceptions. Blue people may resist change more.


Or if Orange achievers feared failure most, that reveals their drive. They may overwork to avoid mistakes.


Comparing tests gives an expanded picture of values in action. More puzzle pieces make the whole image more apparent!


Multiple tests can work together, like colors blending on a palette. Other polls reveal what engages your values, like how your hobbies show what activities you enjoy most. Combined, they paint a richer picture of what motivates our thoughts and deeds.


Below you can read an abridged version of the results of our VUCA poll “Fears“. The full results of our VUCA poll “Fears“ are available for free in the FAQ section after login or registration.


Ängste

Land
Sprache
-
Mail
Neu berechnen
Es gibt eine statistisch signifikante Korrelation (%)
Normalverteilung, von William Sealy Gosset (Student) r = 3.53
Nicht -Normalverteilung durch Spearman r = 0.14
Umfragefragen
Alle Fragen
Alle Fragen
Meine größte Angst ist
Verteilung
Positive Korrelation,% Negative Korrelation,%
Normal
-14.6
Answer 1
-9
Answer 2
-1.3
Answer 3
-8.8
Answer 4
-16.2
Answer 5
-2.8
Answer 6
-4.7
Answer 7
-12.9
Answer 8
-17.3
Answer 9
-12.8
Answer 10
-11.7
Answer 11
-14.6
Answer 12
-15.4
Answer 13
-11.1
Answer 14
-11.2
Answer 15
-7
Answer 16
Normal
7.6
Answer 3
1
Answer 4
8
Answer 6
5.8
Answer 7
1.2
Answer 8
2.8
Answer 11
3.3
Answer 12
2
Answer 13
1.4
Answer 15
2.1
Answer 16
-1.1
Answer 1
-1.3
Answer 5
-5.4
Answer 9
-1.7
Answer 10
-0.3
Answer 14
Normal
3.6
Answer 1
3.9
Answer 2
5
Answer 3
3.3
Answer 4
0.2
Answer 5
1.5
Answer 6
3.8
Answer 7
2.9
Answer 8
3.4
Answer 10
1.7
Answer 11
2.6
Answer 12
4.3
Answer 13
7.2
Answer 16
-1.5
Answer 9
-1.1
Answer 14
-1.2
Answer 15
Normal
8.6
Answer 1
6.6
Answer 2
1.1
Answer 4
6.5
Answer 5
1.2
Answer 8
7.7
Answer 9
2.5
Answer 10
0.2
Answer 11
3.3
Answer 12
2.2
Answer 13
1.6
Answer 15
-5.6
Answer 3
-1.1
Answer 6
-3.2
Answer 7
-0.7
Answer 14
-5.2
Answer 16
Normal
1.5
Answer 5
1.2
Answer 9
0.8
Answer 11
1.6
Answer 14
-1.1
Answer 1
-3.4
Answer 2
-3.9
Answer 3
-0.2
Answer 4
-5.5
Answer 6
-5.1
Answer 7
-2.4
Answer 8
-1.6
Answer 10
-3
Answer 12
-3.9
Answer 13
-3.5
Answer 15
-2.7
Answer 16
Non
normal
2.3
Answer 1
0.1
Answer 2
2.2
Answer 4
11.7
Answer 5
3.4
Answer 7
7.4
Answer 8
15.1
Answer 9
6.6
Answer 10
4.4
Answer 11
9.4
Answer 12
9.6
Answer 13
10.1
Answer 14
12.4
Answer 15
1.8
Answer 16
-2
Answer 3
Normal
4.1
Answer 1
2
Answer 2
0.4
Answer 3
3.7
Answer 4
1.4
Answer 5
0.4
Answer 6
2
Answer 7
7.1
Answer 8
5.8
Answer 9
7.2
Answer 10
5.4
Answer 11
2.8
Answer 12
5.9
Answer 13
6.7
Answer 14
5.9
Answer 15
6.5
Answer 16


Export nach MS Excel
Diese Funktionalität ist in Ihren eigenen VUCA-Umfragen verfügbar
OK

2023.11.22
Valerii Kosenko
Produktbesitzer SaaS Pet Project SDest®

Valerii war 1993 als Sozialpädagoge-Psychologe qualifiziert und hat seitdem sein Wissen im Projektmanagement angewendet.
Valerii erhielt 2013 einen Master -Abschluss und die Qualifikation für Projekt- und Programmmanager. Während seines Master -Programms wurde er mit Project Roadmap (GPM Deutsche Gesellschaft für Projektmanagement e. V.) und Spiraldynamik vertraut.
Valerii absolvierte verschiedene Spiraldynamik -Tests und nutzte sein Wissen und seine Erfahrung, um die aktuelle Version von Sdest anzupassen.
Valerii ist der Autor der Untersuchung der Unsicherheit des V.U.C.A. Konzept unter Verwendung der Spiraldynamik und mathematischen Statistiken in der Psychologie, mehr als 20 internationale Umfragen.
Dieser Beitrag hat 0 Kommentare
Antwort an
Eine Antwort stornieren
Hinterlasse ein Kommentar
×
SIE FINDEN EINEN FEHLER
Schlagen Sie Ihre richtige Version vor
Geben Sie Ihre E-Mail-Adresse wie gewünscht ein
Senden
Stornieren
Bot
sdtest
1
Hi! Lassen Sie mich Sie fragen, vertraut Sie bereits mit Spiraldynamik?