кітап негізінде тест «Spiral Dynamics:
Mastering Values, Leadership, and
Change» (ISBN-13: 978-1405133562)
Демеушілер

The Tale of the Tall Oak

Once upon a time, there was a tiny oak tree sapling named Peety. Peety dreamed of growing up into a mighty oak tree. 


Each year, Peety grew a little bit taller. He stretched his branches toward the sun and felt his trunk thicken as he grew. 


Over many years, Peety grew from a sapling into a young tree and finally into a tall, mature oak! He was so tall that he could see over the whole forest.


Peety noticed that the other tall oak trees had thick trunks, too. His friend Paul reached high into the sky just like Peety. Paul's trunk was thick and sturdy at the base. 


The small saplings that were sprouting had skinny little trunks. But Peety knew that would change over time as they grew taller.


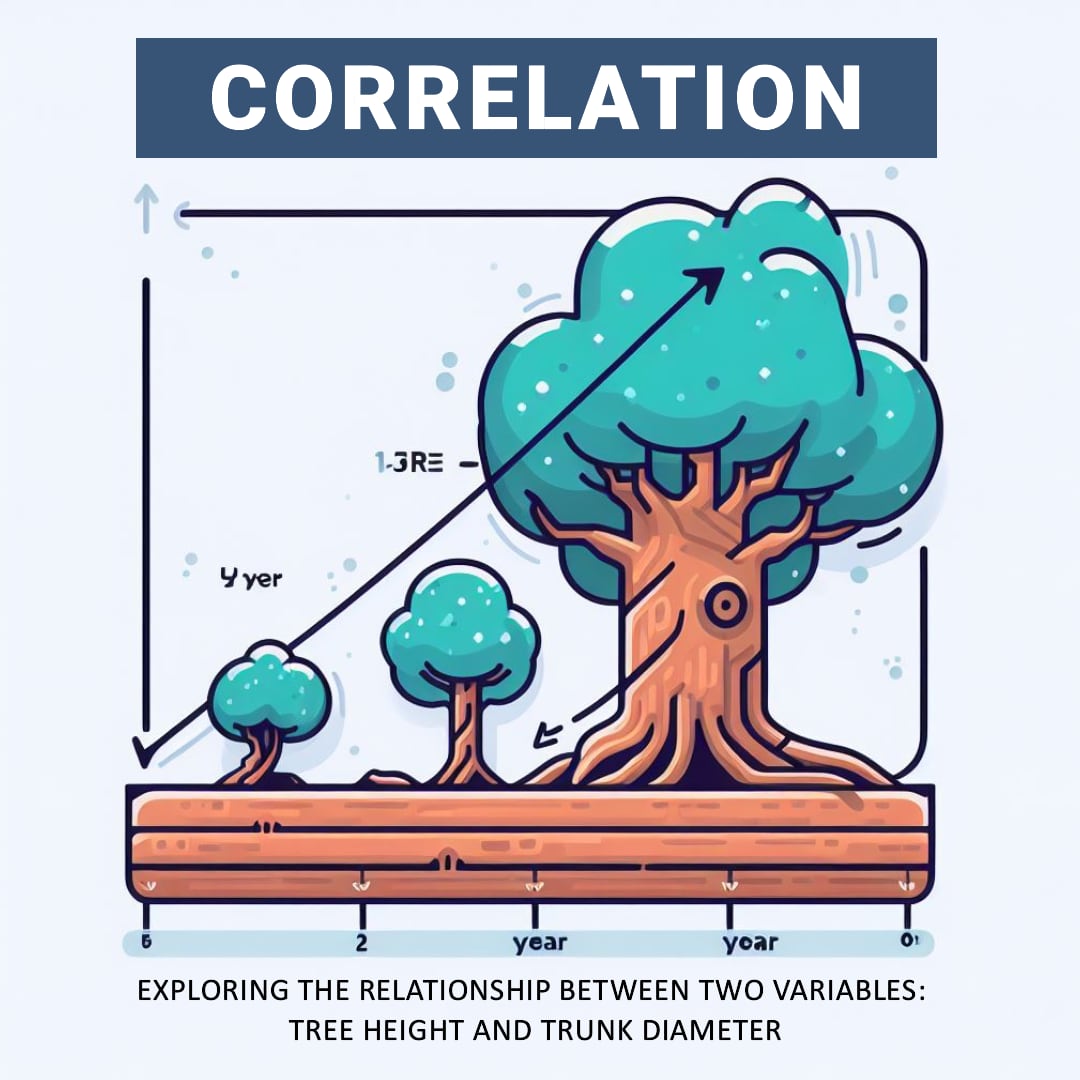
Peety realized that, just like him, the taller an oak tree was, the thicker its trunk became. 


So even though the forest was filled with all different sizes of oak trees, Peety noticed a pattern - a correlation between tree height and trunk width. The tall trees always had thicker trunks, while the small saplings had skinny trunks. This was how pine trees grew strong enough to reach great heights! 


If you record how a tree grows - its height and trunk thickness - and plot it on a picture or graph, then the correlation is when these two things change together. That is, if you see that one is increasing, the other is also increasing, and vice versa.


The SDTEST® gives clues to someone's motivational values. However, additional polls can provide more pieces of the puzzle.


Imagine also giving a "Fears" poll. It asks people to rate different fears from 0 (not scary) to 5 (very scary). 


Now imagine 100 people who took both tests. You could match up each person's SDTEST® colors with their rated fears.


If people high in Blue values feared uncertainty more, that insight ties values to perceptions. Blue people may resist change more.


Or if Orange achievers feared failure most, that reveals their drive. They may overwork to avoid mistakes.


Comparing tests gives an expanded picture of values in action. More puzzle pieces make the whole image more apparent!


Multiple tests can work together, like colors blending on a palette. Other polls reveal what engages your values, like how your hobbies show what activities you enjoy most. Combined, they paint a richer picture of what motivates our thoughts and deeds.


Below you can read an abridged version of the results of our VUCA poll “Fears“. The full results of our VUCA poll “Fears“ are available for free in the FAQ section after login or registration.


Қорқыныш

ел
тіл
-
Mail
Қайта есеппат беру
Статистикалық маңызды корреляция бар
Қалыпты таралу, Уильям теңізі Госсет (студент) r = 3.53
Найзағай емес, найза r = 0.14
Сауалнама сұрақтары
Барлық сұрақтар
Барлық сұрақтар
Менің ең үлкен қорқынышым
Бөлу
Оң корреляциялық,% Теріс корреляция,%
Қалыпты
-14.6
Answer 1
-9
Answer 2
-1.3
Answer 3
-8.8
Answer 4
-16.2
Answer 5
-2.8
Answer 6
-4.7
Answer 7
-12.9
Answer 8
-17.3
Answer 9
-12.8
Answer 10
-11.7
Answer 11
-14.6
Answer 12
-15.4
Answer 13
-11.1
Answer 14
-11.2
Answer 15
-7
Answer 16
Қалыпты
7.6
Answer 3
1
Answer 4
8
Answer 6
5.8
Answer 7
1.2
Answer 8
2.8
Answer 11
3.3
Answer 12
2
Answer 13
1.4
Answer 15
2.1
Answer 16
-1.1
Answer 1
-1.3
Answer 5
-5.4
Answer 9
-1.7
Answer 10
-0.3
Answer 14
Қалыпты
3.6
Answer 1
3.9
Answer 2
5
Answer 3
3.3
Answer 4
0.2
Answer 5
1.5
Answer 6
3.8
Answer 7
2.9
Answer 8
3.4
Answer 10
1.7
Answer 11
2.6
Answer 12
4.3
Answer 13
7.2
Answer 16
-1.5
Answer 9
-1.1
Answer 14
-1.2
Answer 15
Қалыпты
8.6
Answer 1
6.6
Answer 2
1.1
Answer 4
6.5
Answer 5
1.2
Answer 8
7.7
Answer 9
2.5
Answer 10
0.2
Answer 11
3.3
Answer 12
2.2
Answer 13
1.6
Answer 15
-5.6
Answer 3
-1.1
Answer 6
-3.2
Answer 7
-0.7
Answer 14
-5.2
Answer 16
Қалыпты
1.5
Answer 5
1.2
Answer 9
0.8
Answer 11
1.6
Answer 14
-1.1
Answer 1
-3.4
Answer 2
-3.9
Answer 3
-0.2
Answer 4
-5.5
Answer 6
-5.1
Answer 7
-2.4
Answer 8
-1.6
Answer 10
-3
Answer 12
-3.9
Answer 13
-3.5
Answer 15
-2.7
Answer 16
Қалыпты
емес
2.3
Answer 1
0.1
Answer 2
2.2
Answer 4
11.7
Answer 5
3.4
Answer 7
7.4
Answer 8
15.1
Answer 9
6.6
Answer 10
4.4
Answer 11
9.4
Answer 12
9.6
Answer 13
10.1
Answer 14
12.4
Answer 15
1.8
Answer 16
-2
Answer 3
Қалыпты
4.1
Answer 1
2
Answer 2
0.4
Answer 3
3.7
Answer 4
1.4
Answer 5
0.4
Answer 6
2
Answer 7
7.1
Answer 8
5.8
Answer 9
7.2
Answer 10
5.4
Answer 11
2.8
Answer 12
5.9
Answer 13
6.7
Answer 14
5.9
Answer 15
6.5
Answer 16


MS Excel экспорттау
Бұл функция сіздің VUCA сауалнамаларыңызда қол жетімді болады
Жарайды ма

2023.11.22
Валерий Косенко
SAAS PET жобасы

Valerii 1993 жылы әлеуметтік педагог-психолог болып табылды және содан бері жобаларды басқару бойынша білімін қолданды.
Валерий 2013 жылы магистратура мен жоба және бағдарламалық менеджер біліктілігі алынды. Магистратурасы барысында ол магистратура кезінде ол «Жол картасы» бағдарламасымен (GPM Deutsche Gesellschaft Für Projektmanagement E) және спираль динамикасымен танысты.
Валерий түрлі спиральды динамикалық сынақтарды алып, оның білімі мен тәжірибесін SDTest-тің ағымдағы нұсқасын бейімдеу үшін қолданды.
Valerii - v.u.c.діктің белгісіздігін зерттеудің авторы. Психологиядағы спиральды динамика және математикалық статистика, 20-дан астам халықаралық сауалнаманы қолдану туралы түсінік.
Бұл хабарлама бар 0 Пікірлер
Жауап беру
Жауапты болдырмаңыз
Пікір қалдыру
×
Қате сіз таба
СІЗДІҢ дұрыс нұсқасын ұсыну
қалауыңызша Электрондық поштаңызды енгізіңіз
жіберу
күшін жою
Bot
sdtest
1
Сәлем! Сізден сұрайын, сіз спираль динамикамен таныссыз ба?