ном суурилсан тест «Spiral Dynamics:
Mastering Values, Leadership, and
Change» (ISBN-13: 978-1405133562)
Ивээн тэтгэгч

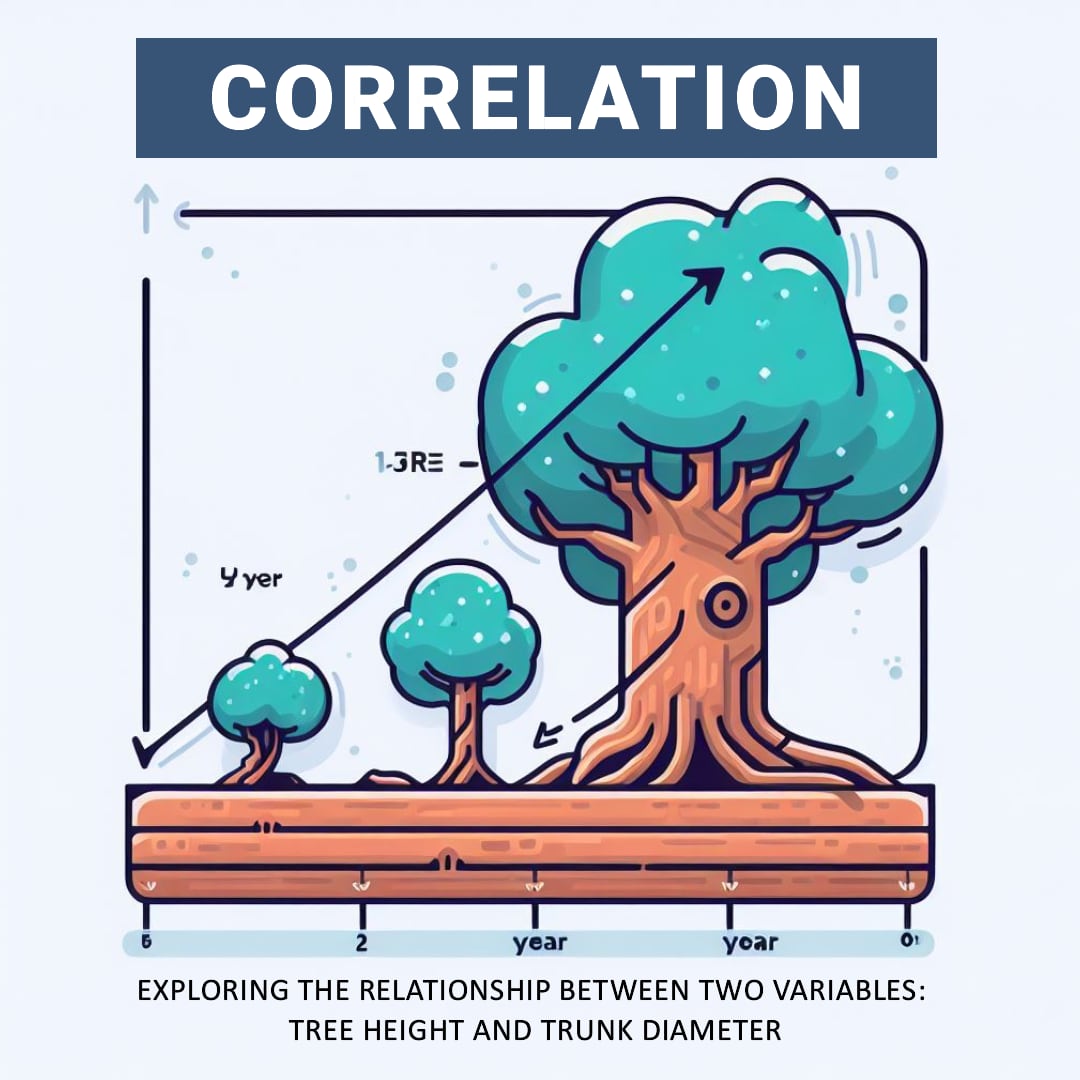
The Tale of the Tall Oak

Once upon a time, there was a tiny oak tree sapling named Peety. Peety dreamed of growing up into a mighty oak tree. 


Each year, Peety grew a little bit taller. He stretched his branches toward the sun and felt his trunk thicken as he grew. 


Over many years, Peety grew from a sapling into a young tree and finally into a tall, mature oak! He was so tall that he could see over the whole forest.


Peety noticed that the other tall oak trees had thick trunks, too. His friend Paul reached high into the sky just like Peety. Paul's trunk was thick and sturdy at the base. 


The small saplings that were sprouting had skinny little trunks. But Peety knew that would change over time as they grew taller.


Peety realized that, just like him, the taller an oak tree was, the thicker its trunk became. 


So even though the forest was filled with all different sizes of oak trees, Peety noticed a pattern - a correlation between tree height and trunk width. The tall trees always had thicker trunks, while the small saplings had skinny trunks. This was how pine trees grew strong enough to reach great heights! 


If you record how a tree grows - its height and trunk thickness - and plot it on a picture or graph, then the correlation is when these two things change together. That is, if you see that one is increasing, the other is also increasing, and vice versa.


The SDTEST® gives clues to someone's motivational values. However, additional polls can provide more pieces of the puzzle.


Imagine also giving a "Fears" poll. It asks people to rate different fears from 0 (not scary) to 5 (very scary). 


Now imagine 100 people who took both tests. You could match up each person's SDTEST® colors with their rated fears.


If people high in Blue values feared uncertainty more, that insight ties values to perceptions. Blue people may resist change more.


Or if Orange achievers feared failure most, that reveals their drive. They may overwork to avoid mistakes.


Comparing tests gives an expanded picture of values in action. More puzzle pieces make the whole image more apparent!


Multiple tests can work together, like colors blending on a palette. Other polls reveal what engages your values, like how your hobbies show what activities you enjoy most. Combined, they paint a richer picture of what motivates our thoughts and deeds.


Below you can read an abridged version of the results of our VUCA poll “Fears“. The full results of our VUCA poll “Fears“ are available for free in the FAQ section after login or registration.


Аймаг

Улс
хэл
-
Mail
Дахин тооцоолох
Нь статистик ач холбогдолтой хамаарал байдаг
Ердийн хуваарилалт, Уильям далайн эргэлт (оюутан) r = 3.53
Энгийн бус хуваарилалт, Spearman r = 0.14
Асуултын үгс
Бүх асуулт
Бүх асуулт
Миний хамгийн том айдас бол
Хувиарилалт
Эерэг хамаарал,% Сөрөг хамаарал,%
Хэвийн байдал
-14.5
Answer 1
-9
Answer 2
-1.3
Answer 3
-8.7
Answer 4
-16.2
Answer 5
-2.9
Answer 6
-4.9
Answer 7
-12.8
Answer 8
-17.2
Answer 9
-12.6
Answer 10
-11.7
Answer 11
-14.5
Answer 12
-15.3
Answer 13
-10.8
Answer 14
-11.1
Answer 15
-6.8
Answer 16
Хэвийн байдал
7.7
Answer 3
0.9
Answer 4
8
Answer 6
5.7
Answer 7
1.1
Answer 8
2.7
Answer 11
3.4
Answer 12
2.1
Answer 13
1.4
Answer 15
2.2
Answer 16
-1.1
Answer 1
-0.1
Answer 2
-1.3
Answer 5
-5.5
Answer 9
-1.6
Answer 10
-0.3
Answer 14
Хэвийн байдал
3.7
Answer 1
3.9
Answer 2
5.2
Answer 3
3.2
Answer 4
0.2
Answer 5
1.7
Answer 6
3.9
Answer 7
3.1
Answer 8
3.3
Answer 10
1.8
Answer 11
2.6
Answer 12
4.4
Answer 13
7.3
Answer 16
-1.4
Answer 9
-1.1
Answer 14
-1.1
Answer 15
Хэвийн байдал
8.5
Answer 1
6.7
Answer 2
1.1
Answer 4
6.6
Answer 5
1.2
Answer 8
7.8
Answer 9
2.4
Answer 10
0.2
Answer 11
3.4
Answer 12
2.2
Answer 13
1.5
Answer 15
-5.5
Answer 3
-1
Answer 6
-3
Answer 7
-0.8
Answer 14
-5.1
Answer 16
Хэвийн байдал
1.4
Answer 5
1
Answer 9
0.6
Answer 11
1.4
Answer 14
-1.1
Answer 1
-3.4
Answer 2
-4.1
Answer 3
-0.2
Answer 4
-5.7
Answer 6
-5.1
Answer 7
-2.6
Answer 8
-1.7
Answer 10
-3.2
Answer 12
-4.1
Answer 13
-3.7
Answer 15
-3
Answer 16
Энзлийн
биш
2.3
Answer 1
0.2
Answer 2
2.2
Answer 4
11.7
Answer 5
3.4
Answer 7
7.5
Answer 8
15.1
Answer 9
6.6
Answer 10
4.4
Answer 11
9.3
Answer 12
9.5
Answer 13
10.1
Answer 14
12.3
Answer 15
1.6
Answer 16
-2.1
Answer 3
-0.1
Answer 6
Хэвийн байдал
4.1
Answer 1
2.1
Answer 2
0.3
Answer 3
3.6
Answer 4
1.2
Answer 5
0.4
Answer 6
1.9
Answer 7
7.1
Answer 8
5.8
Answer 9
7.2
Answer 10
5.4
Answer 11
2.7
Answer 12
5.9
Answer 13
6.7
Answer 14
5.8
Answer 15
6.4
Answer 16


MS Excel Экспортын
Энэ функцийг өөрийн VUCA санал асуулгад ашиглах боломжтой
Болж байна уу

2023.11.22
VALERII KOSENKO
Бүтээгдэхүүний эзэн SAAS POTE PONES SDTEST®

VALERII нь 1993 онд Нийгмийн хөгжлийн бэрхшээлтэй байсан бөгөөд 1993 онд нийгмийн хөгжлийн бэрхшээлтэй байсан бөгөөд Төслийн менежментийн мэдлэгээ хэрэглэснээс хойш.
WALERII нь магистрын зэрэг, төсөл, хөтөлбөр, хөтөлбөрийн менежерийг олж авсан бөгөөд энэ нь төслийн хөтөлбөр, Projectmap-тэй танилцуулсан.
Валерии нь янз бүрийн спираль динамик тестийг авч, өөрийн мэдлэг, туршлагыг ашигласан бөгөөд энэ нь SDTEST-ийн одоогийн хувилбарыг дасан зохицоход ашигласан.
Валери бол V.U.C.C.A-ийн тодорхой бус байдлыг судлах зохиогч юм. Спираль динамик, математик статистикийг сэтгэцийн санал, 20 гаруй олон улсын санал асуулга.
Энэ бичлэг нь 0 Смхиман
Хариулж
Хариулт цуцлах
Сэтгэгдэл орхих
×
Та алдаа олж
ТАНЫ зөв хувилбарыг санал болгож байна
хүссэн нь таны и-мэйл оруулна уу
илгээх
Болих
Bot
sdtest
1
Сайн уу! Танаас асууя, та спираль динамиктай танилцсан уу?